Copyright
©The Author(s) 2018.
World J Gastroenterol. Jul 14, 2018; 24(26): 2886-2892
Published online Jul 14, 2018. doi: 10.3748/wjg.v24.i26.2886
Published online Jul 14, 2018. doi: 10.3748/wjg.v24.i26.2886
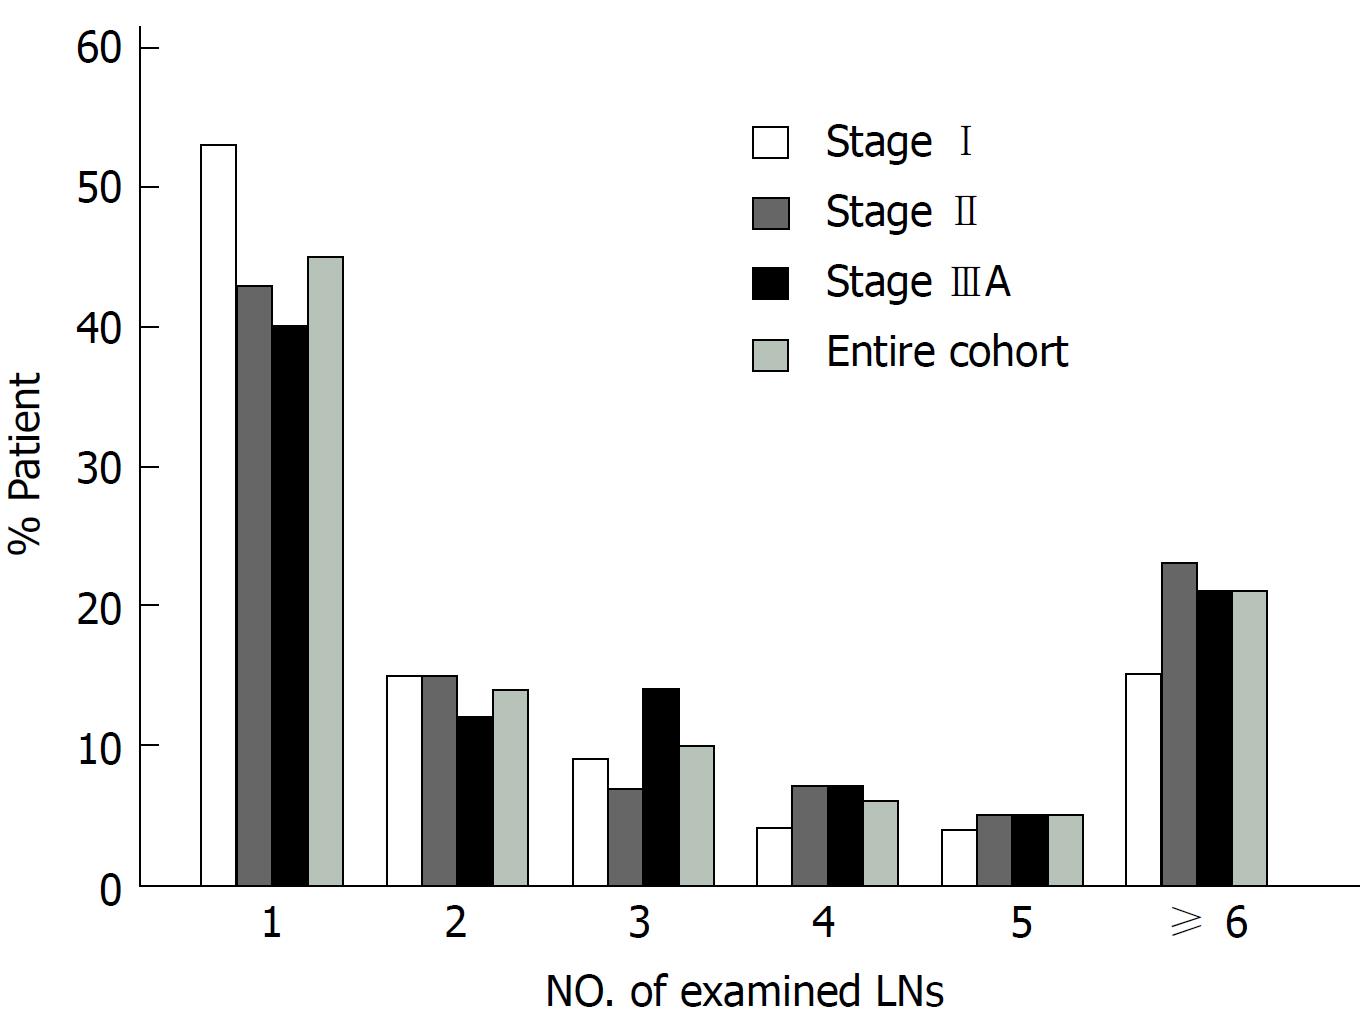
Figure 1 Number of examined lymph nodes was categorized into subgroups.
The bars in the graph reflect the percentage of patients who fell into each subgroup. Entire cohort, n = 893; stage I, n = 228; stage II, n = 444; stage IIIA, n = 221.
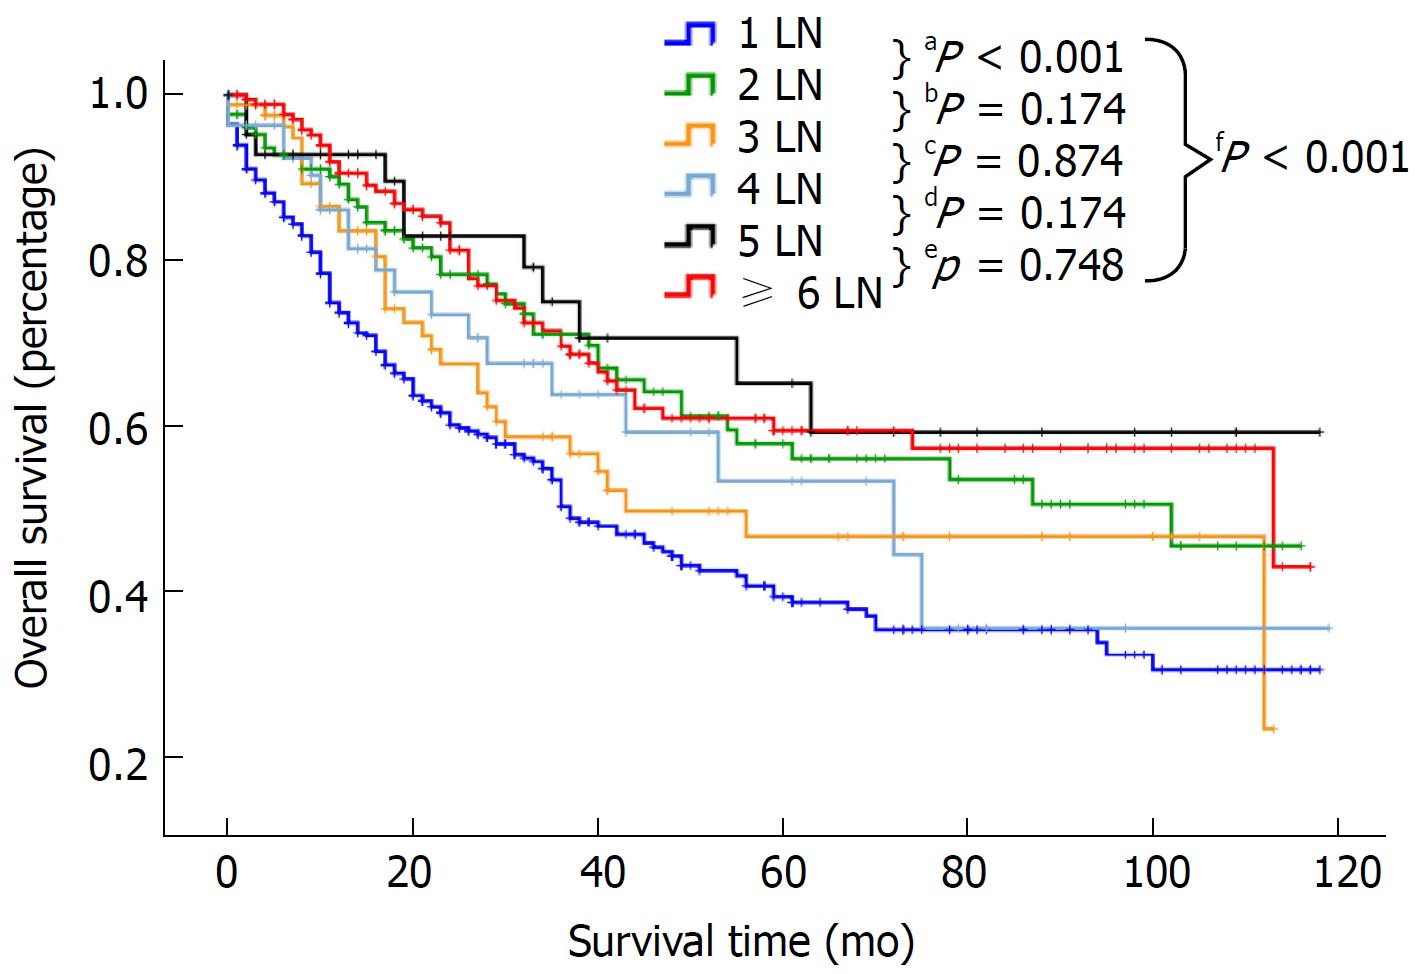
Figure 2 Overall survival curves for the entire cohort comparing patients with 1, 2, 3, 4, 5, and ≥ 6 examined lymph nodes.
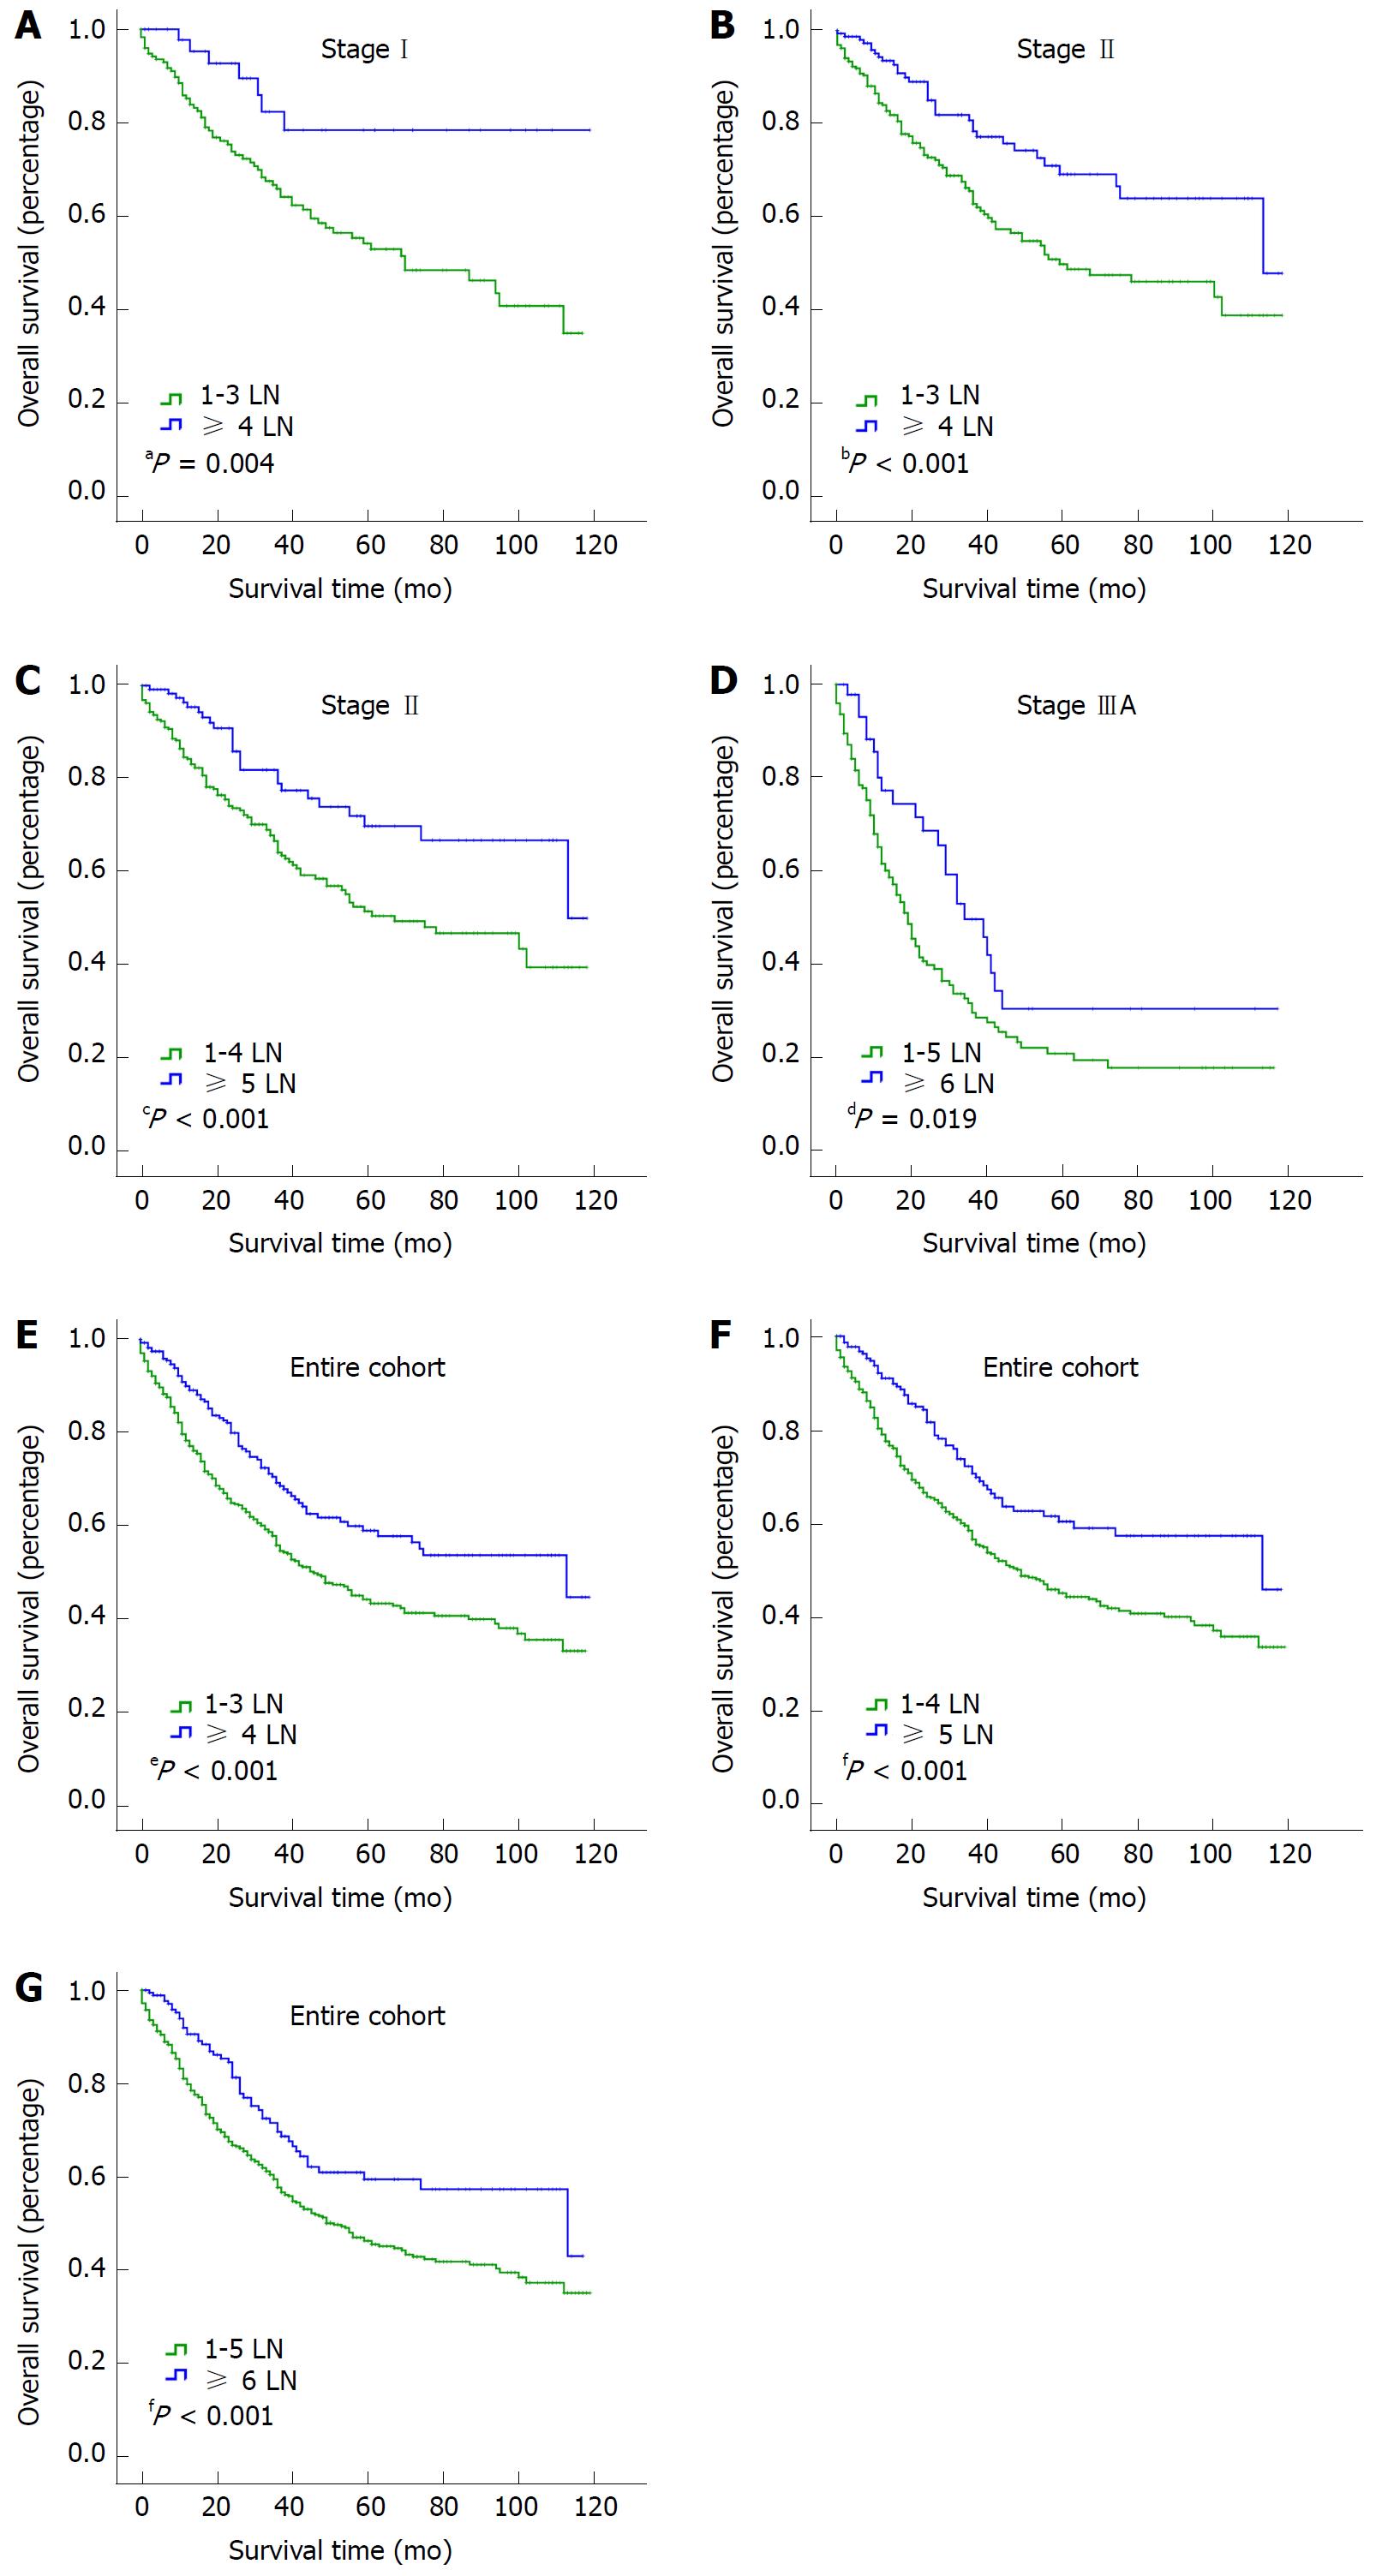
Figure 3 Overall survival curves for the entire cohort and the stage I, II, and IIIA groups and optimal dichotomization by the number of examined lymph nodes.
A: Stage I, LN = 4, P = 0.004; B: Stage II, LN = 4, P ≤ 0.001; C: Stage II, LN = 5, P ≤ 0.001; D: Stage IIIA, LN = 6, P = 0.019; E: Entire cohort, LN = 4, P ≤ 0.001; F: Entire cohort, LN = 5, P ≤ 0.001; G: Entire cohort, LN = 6, P < 0.001. LN: Lymph node.
- Citation: Fan DX, Xu RW, Li YC, Zhao BQ, Sun MY. Impact of the number of examined lymph nodes on outcomes in patients with lymph node-negative gallbladder carcinoma. World J Gastroenterol 2018; 24(26): 2886-2892
- URL: https://www.wjgnet.com/1007-9327/full/v24/i26/2886.htm
- DOI: https://dx.doi.org/10.3748/wjg.v24.i26.2886


