Copyright
©The Author(s) 2018.
World J Gastroenterol. Jun 28, 2018; 24(24): 2605-2616
Published online Jun 28, 2018. doi: 10.3748/wjg.v24.i24.2605
Published online Jun 28, 2018. doi: 10.3748/wjg.v24.i24.2605
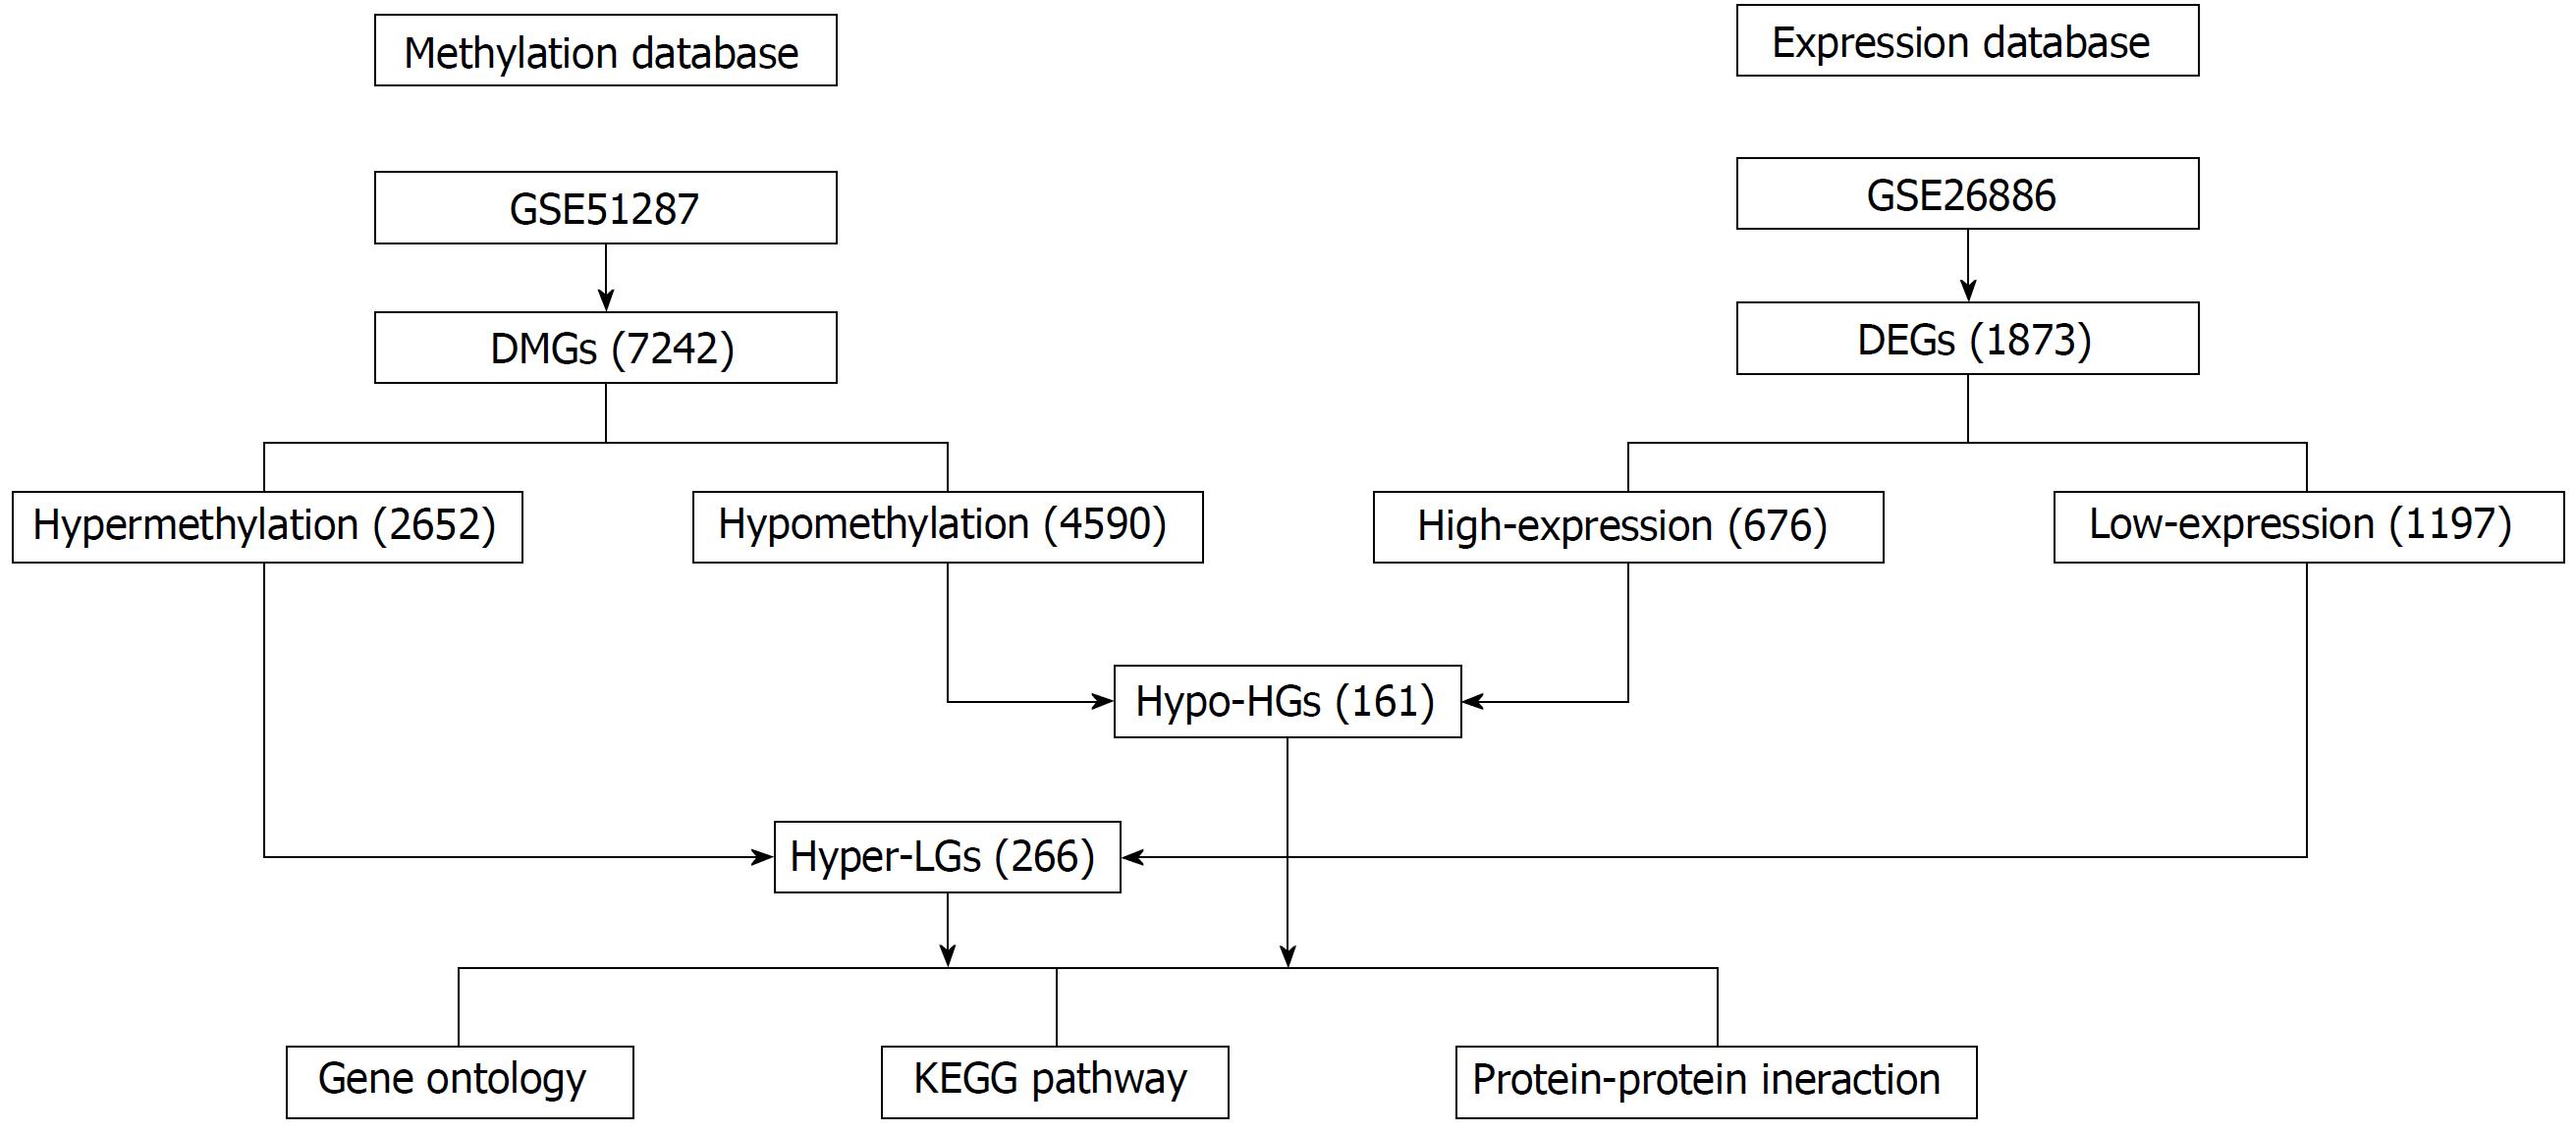
Figure 1 Flowchart of bioinformatics analysis.
DMGs: Differentially methylated genes; DEGs: Differentially expressed genes; Hyper-LGs: Hypermethylated, lowly expressed genes; Hypo-HGs: Hypomethylated, highly expressed genes.
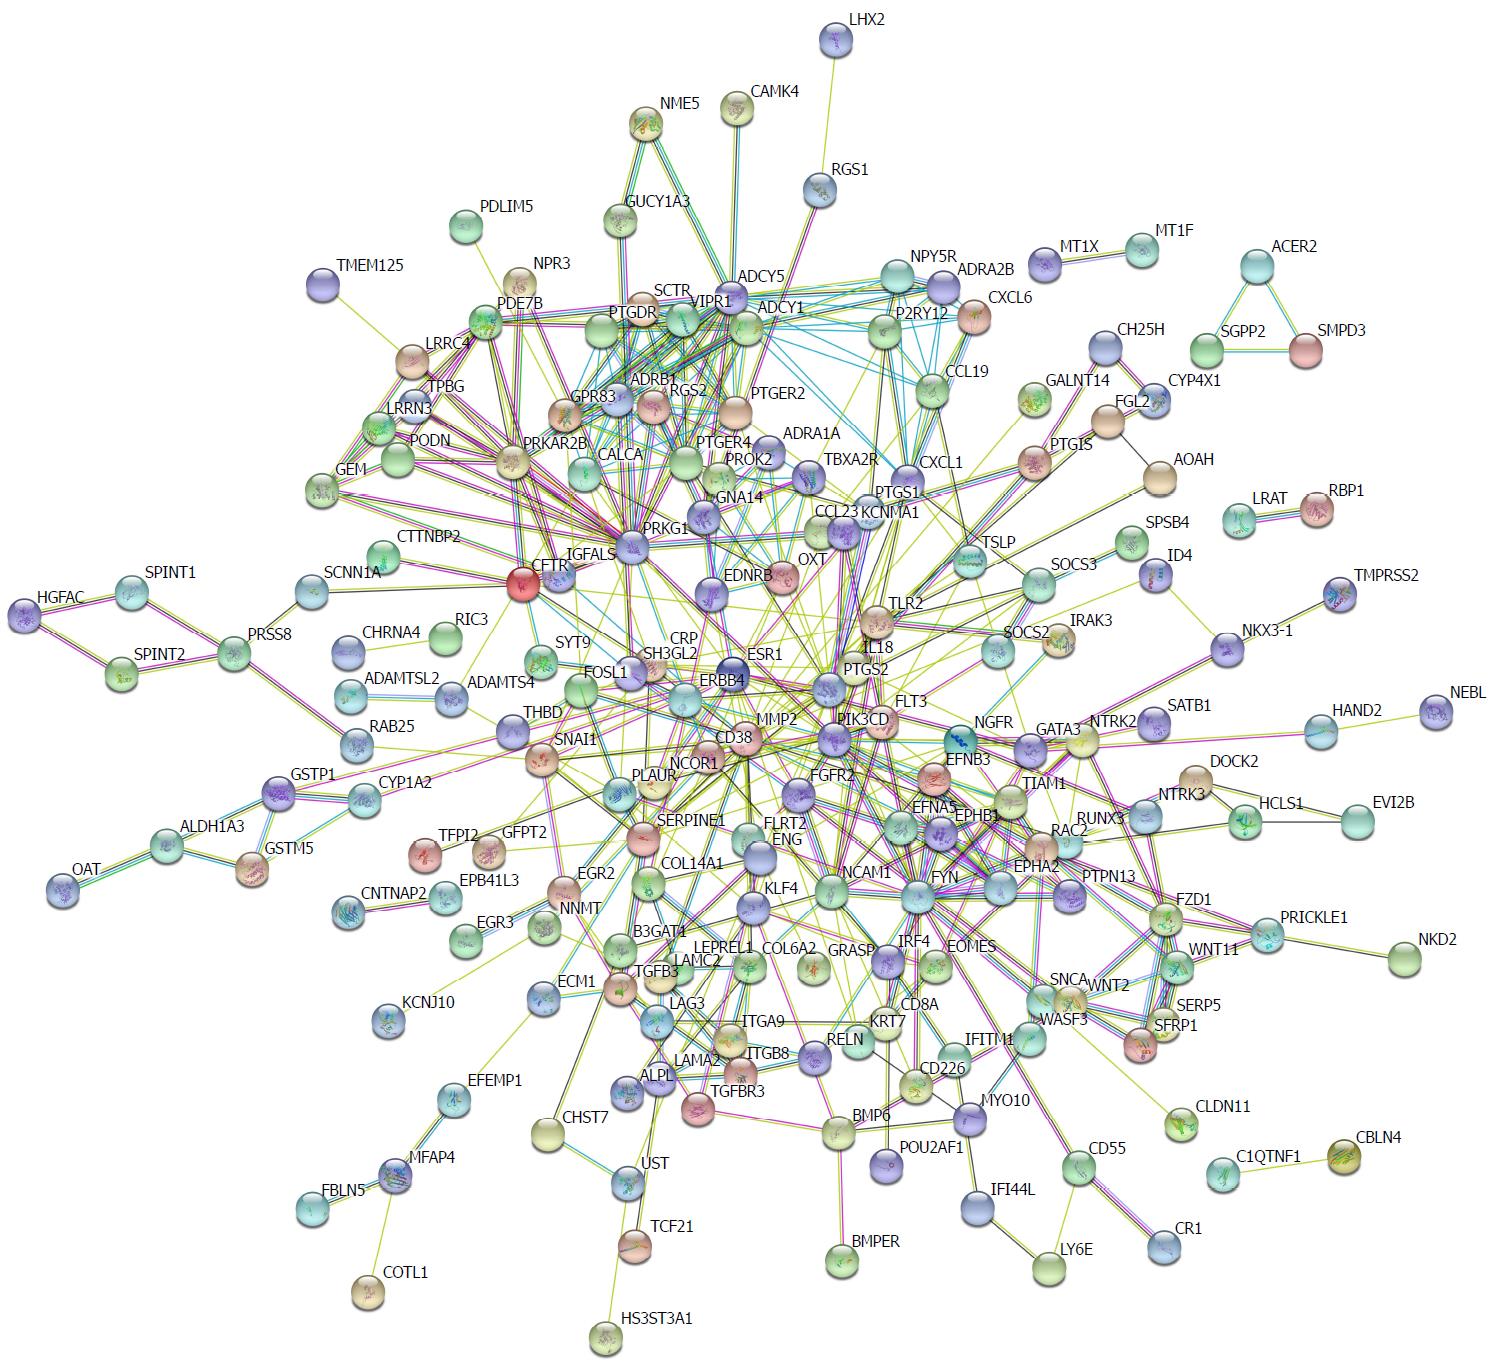
Figure 2 Protein-protein interaction network of hypermethylated, lowly expressed genes.
Disconnected nodes were hid in the network.
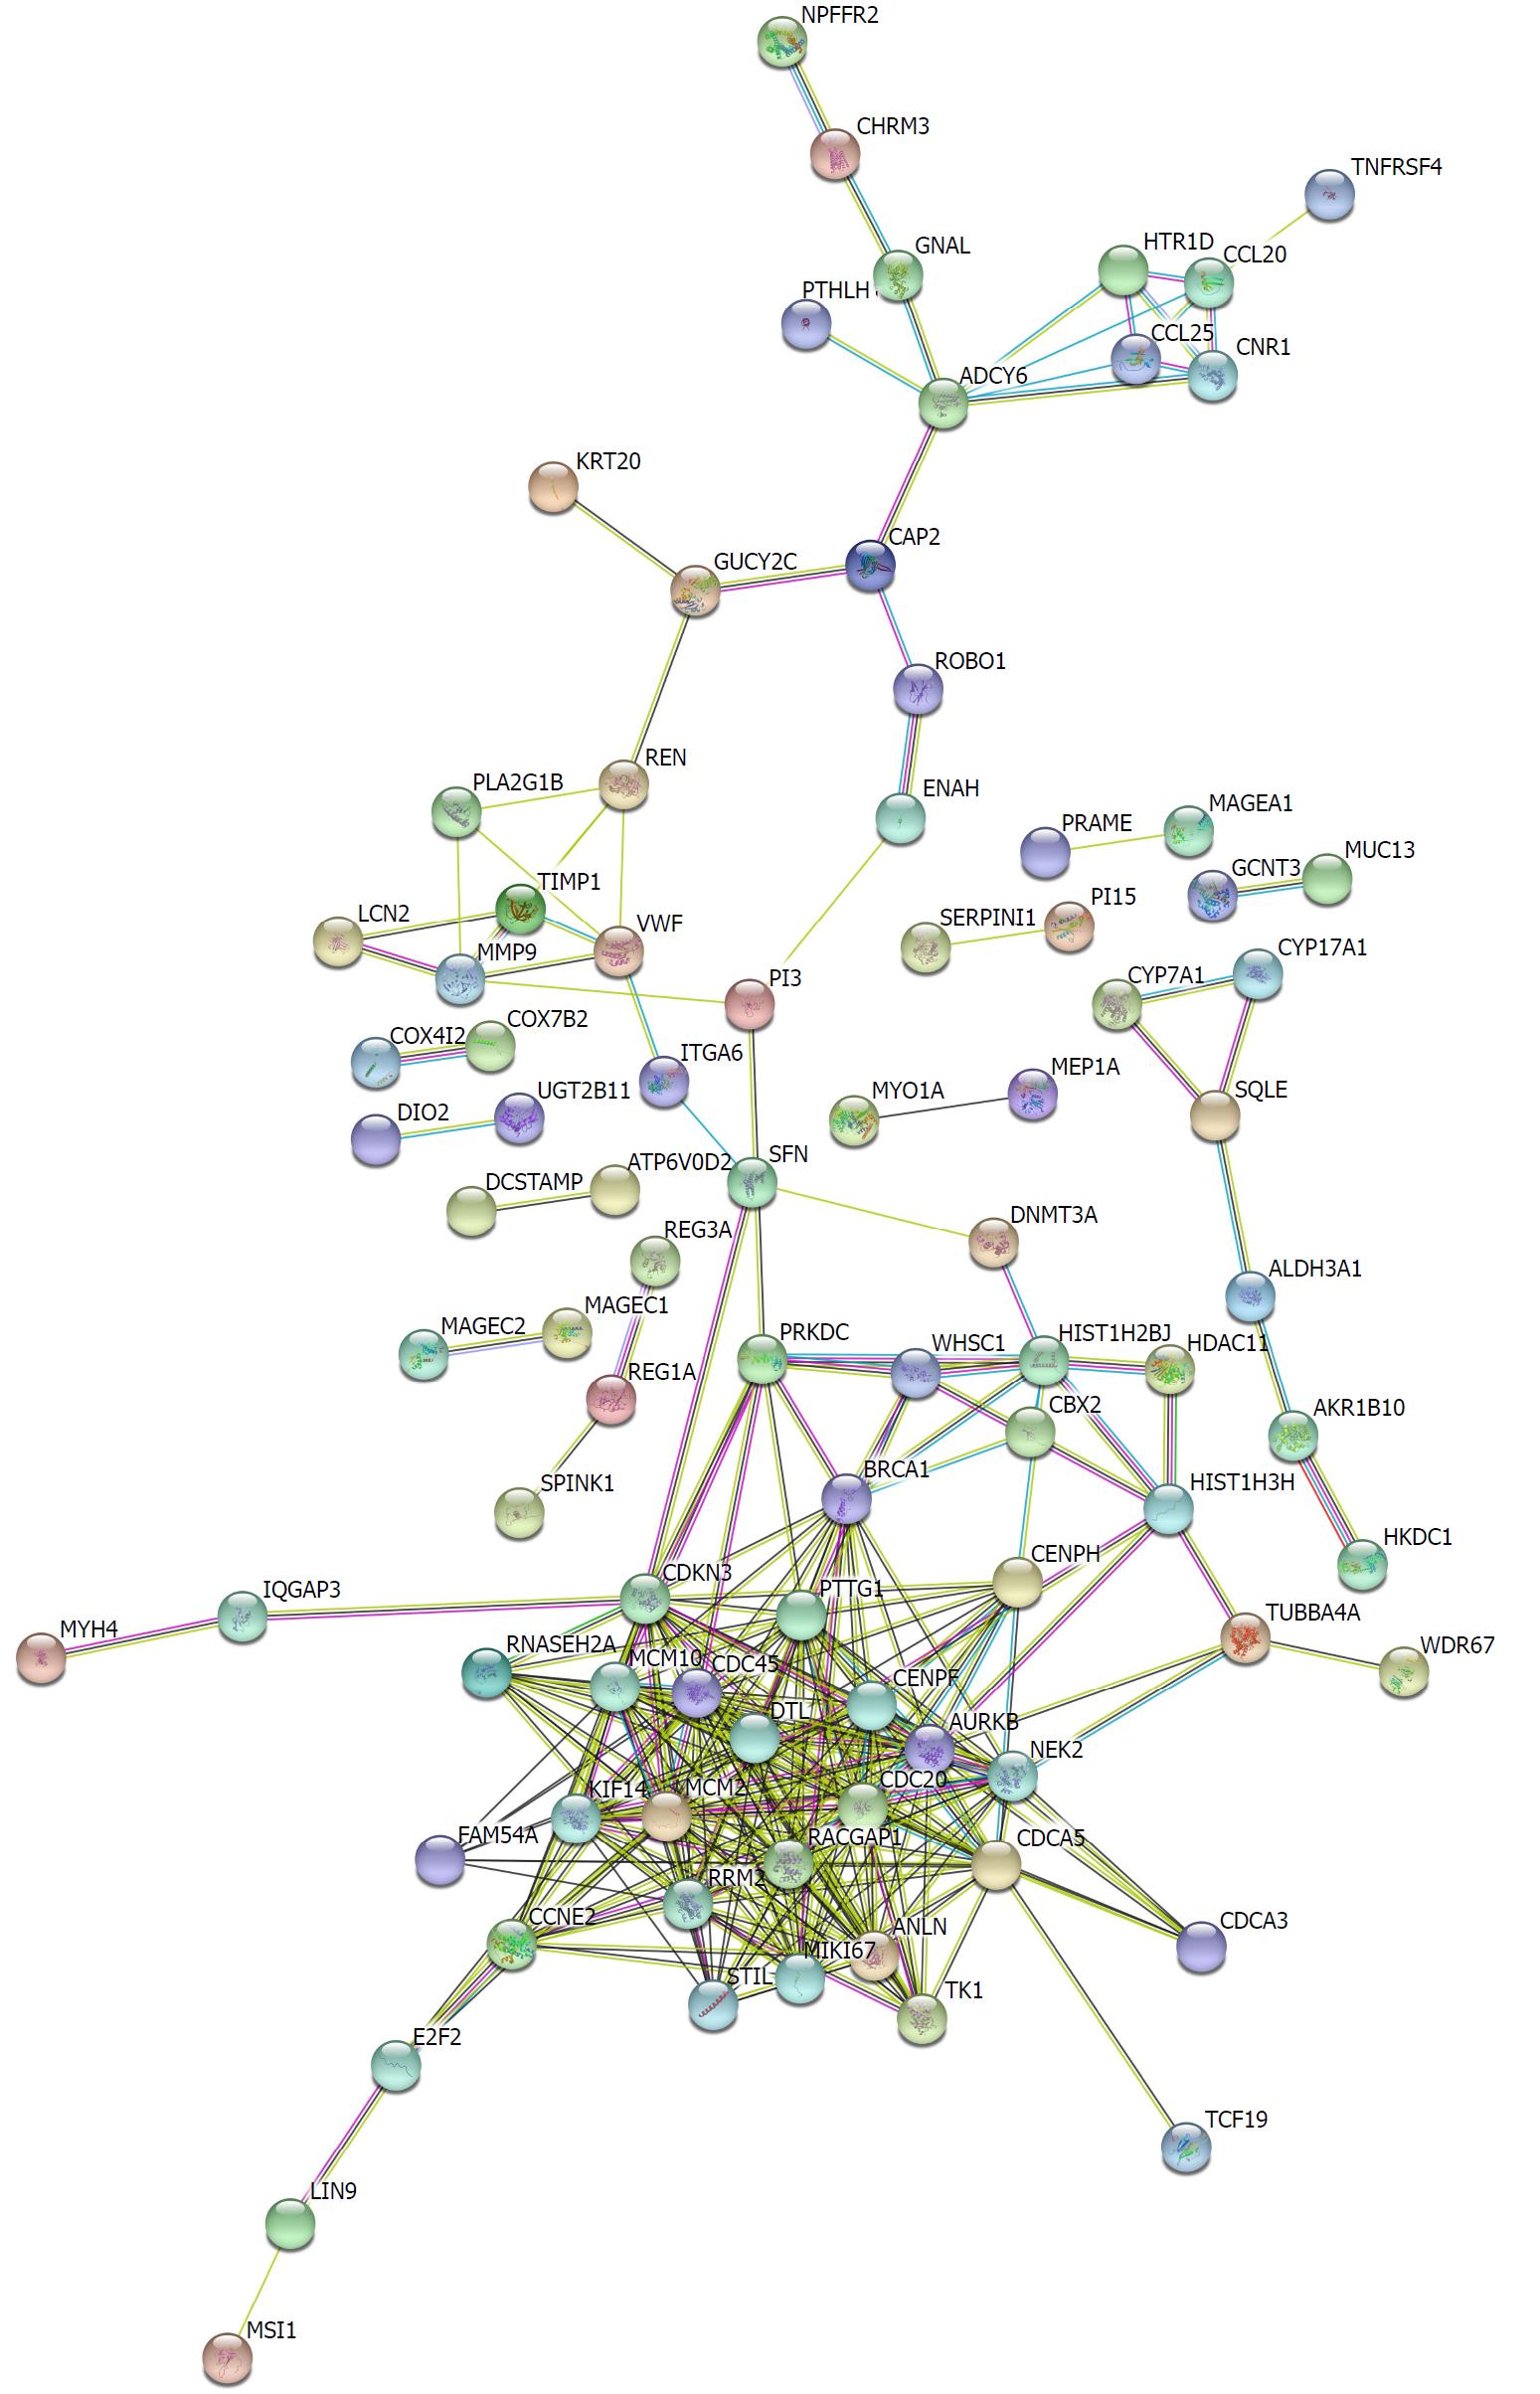
Figure 3 Protein-protein interaction network of hypomethylated, highly expressed genes.
Disconnected nodes were hid in the network.
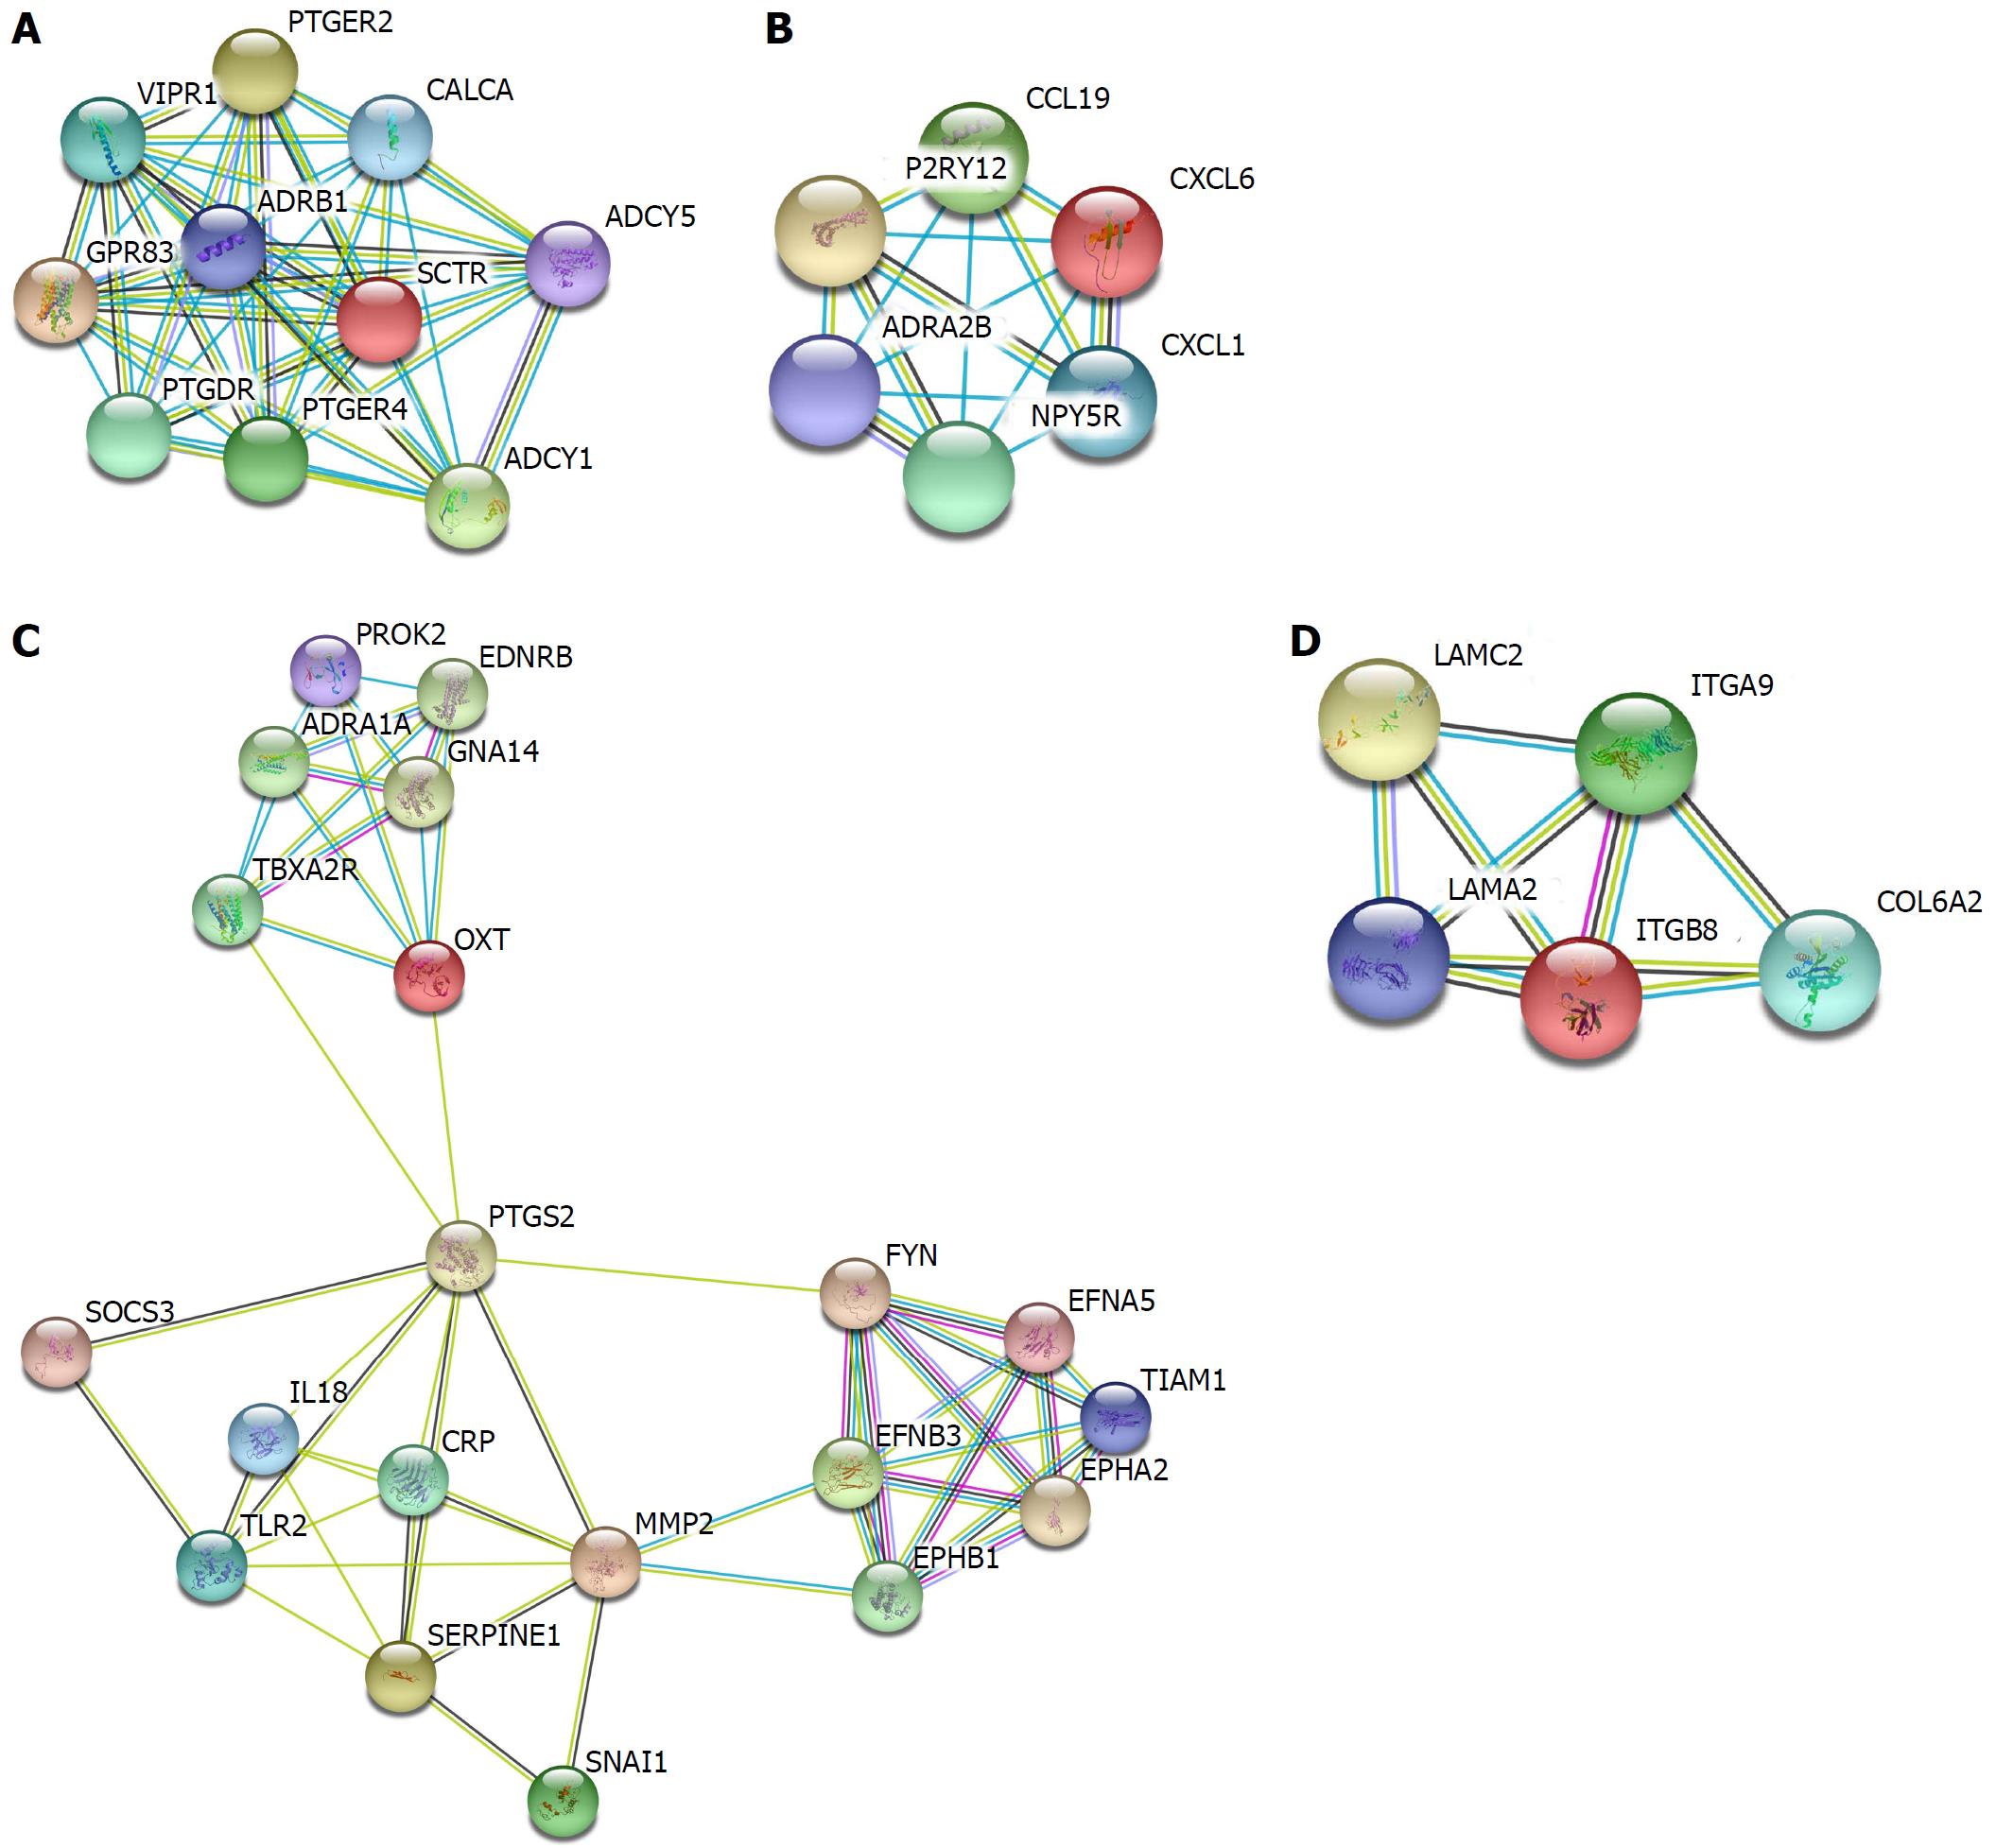
Figure 4 Hypermethylated, lowly expressed genes modules.
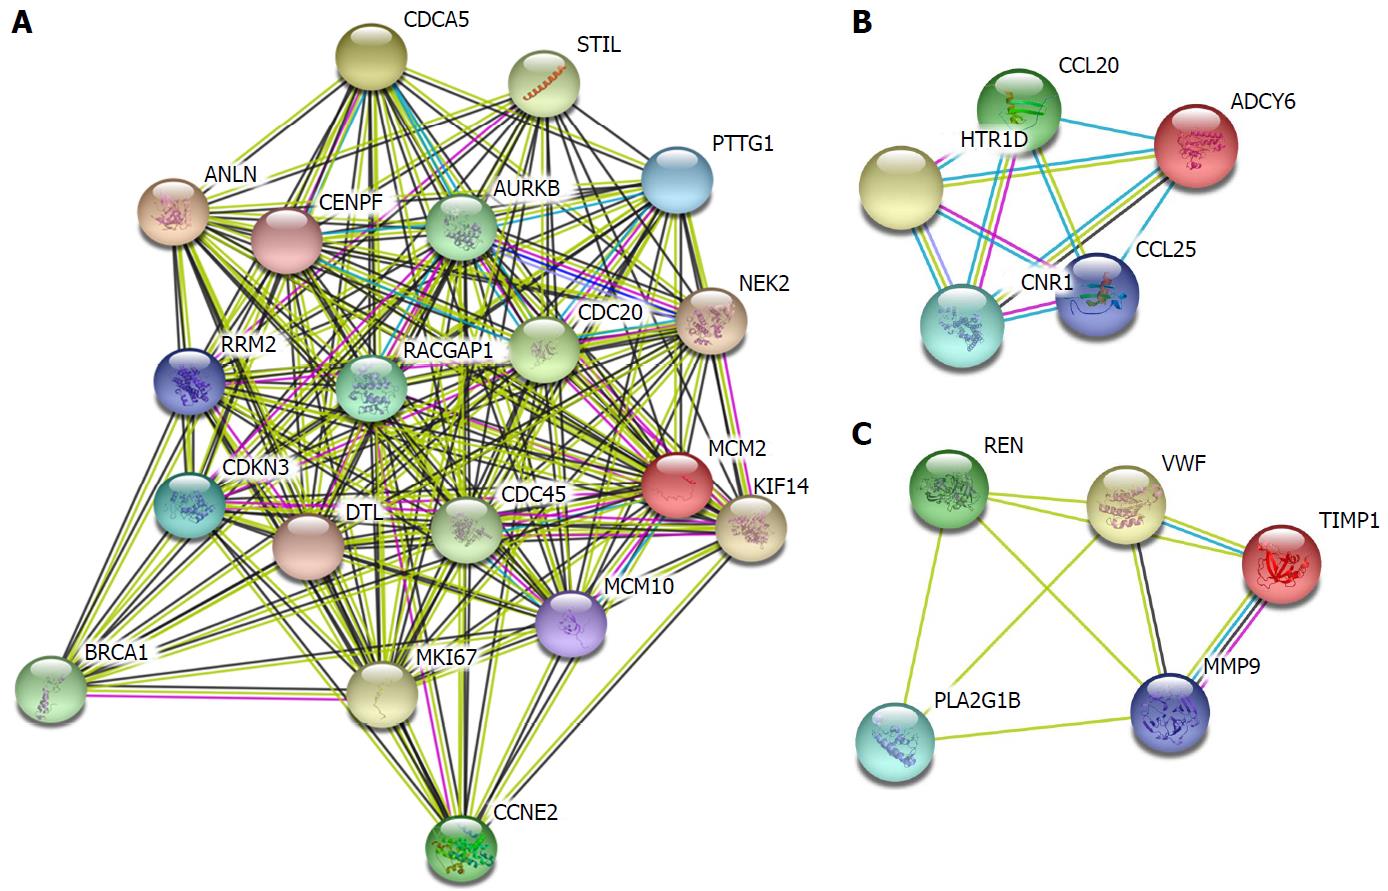
Figure 5 Hypomethylated, highly expressed genes modules.
- Citation: Sang L, Wang XM, Xu DY, Zhao WJ. Bioinformatics analysis of aberrantly methylated-differentially expressed genes and pathways in hepatocellular carcinoma. World J Gastroenterol 2018; 24(24): 2605-2616
- URL: https://www.wjgnet.com/1007-9327/full/v24/i24/2605.htm
- DOI: https://dx.doi.org/10.3748/wjg.v24.i24.2605


