©The Author(s) 2018.
World J Gastroenterol. Jan 14, 2018; 24(2): 170-178
Published online Jan 14, 2018. doi: 10.3748/wjg.v24.i2.170
Published online Jan 14, 2018. doi: 10.3748/wjg.v24.i2.170
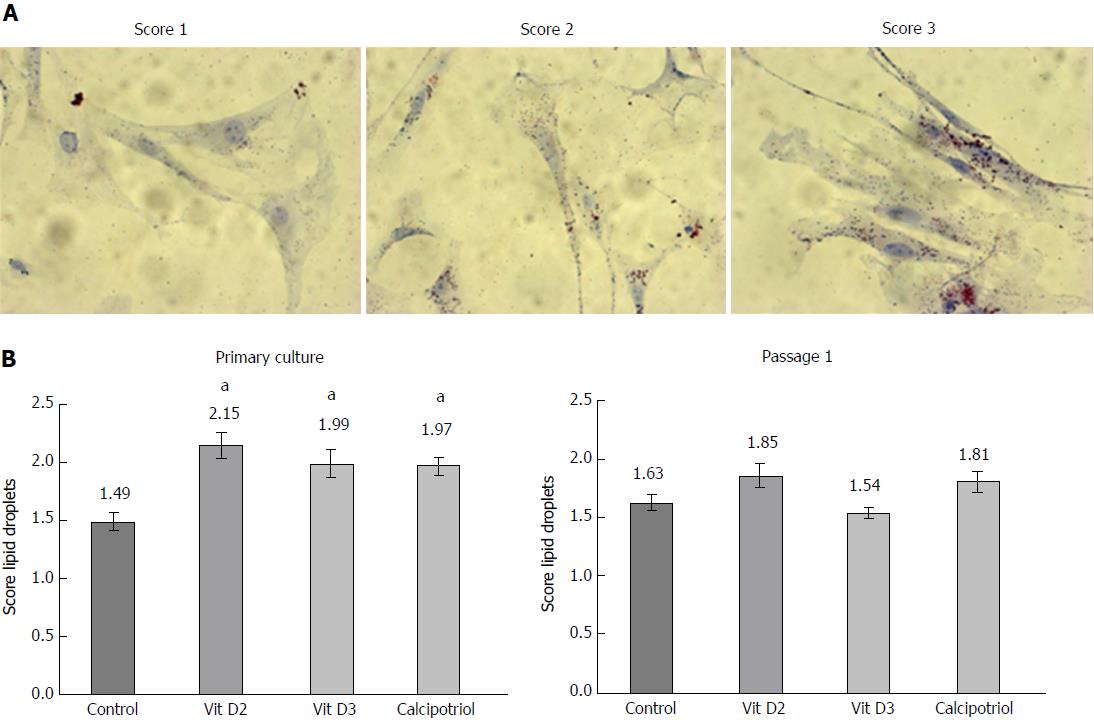
Figure 1 D-vitamins prevent loss of lipid droplets in quiescent pancreatic stellate cells.
Pancreatic stellate cells in primary culture (days 1-4) and of passage 1 (days 1-3) were exposed to the indicated D-vitamins at 100 nmol/L each. Afterwards, intracellular lipids were stained with oil-red, and size/number of lipid droplets were assessed on a semiquantitative scale from 0 to 3. A: Exemplary stains for scores 1-3 (original magnification, × 400); B: Shown are the mean scores of n ≥ 14 independent samples (mean ± SE) for primary cultures (left panel) and passaged cells (right panel). aP < 0.05 vs untreated controls.
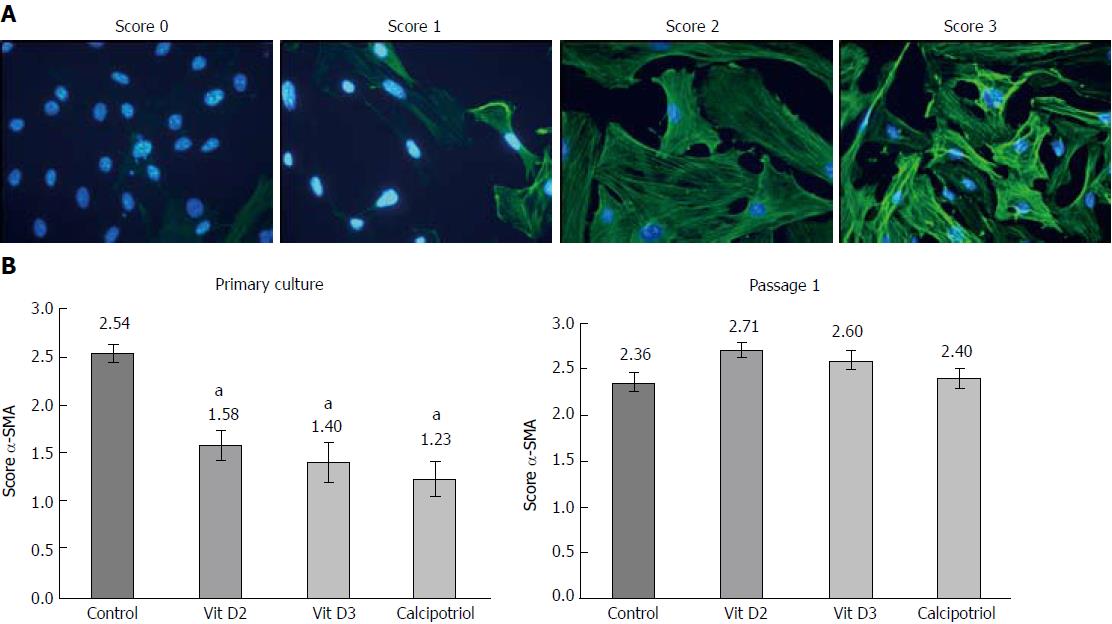
Figure 2 D-vitamins inhibit formation of stress fiber bundles.
Pancreatic stellate cells in primary culture (days 1-4) and of passage 1 (days 1-3) were treated with the indicated D-vitamins at 100 nmol/L each. Subsequently, α-smooth muscle actin (α-SMA) fibres (green) were visualized by immunofluorescence staining; while nuclei were counterstained with DNA with 4’,6-diamidino-2-phenylindole (blue). Expression of α-SMA and formation of stress fiber bundles were assessed on a semiquantitative scale from 0 to 3. Exemplary stains for each score are shown in (A) (original magnification, × 630). In (B), mean values of n ≥ 12 independent samples ± SE for primary cultures (left panel) and passaged cells (right panel) are shown. aP < 0.05 vs untreated controls.
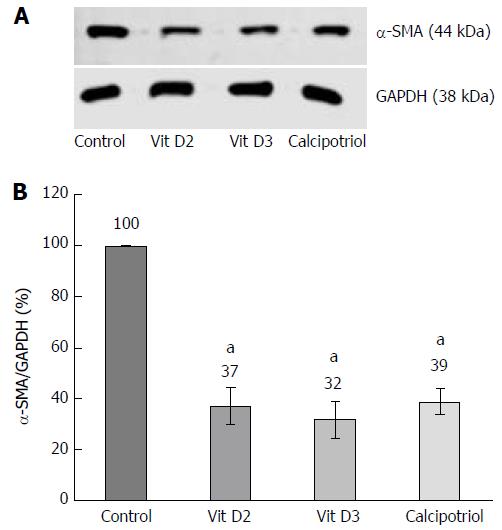
Figure 3 D-vitamins reduce protein levels of α-smooth muscle actin in primary cultured pancreatic stellate cells.
Pancreatic stellate cells were treated with the indicated D-vitamins (100 nmol/L each) from day 1-4 of primary culture, before expression of α-smooth muscle actin (α-SMA) and the housekeeping protein GAPDH was assessed by Western blot analysis (see A for a typical experiment); B: Intensities of fluorescence signals were expressed as ratio α-SMA/GAPDH. Data of 5 independent experiments were used to calculate mean ± SE. aP < 0.05 vs untreated controls.
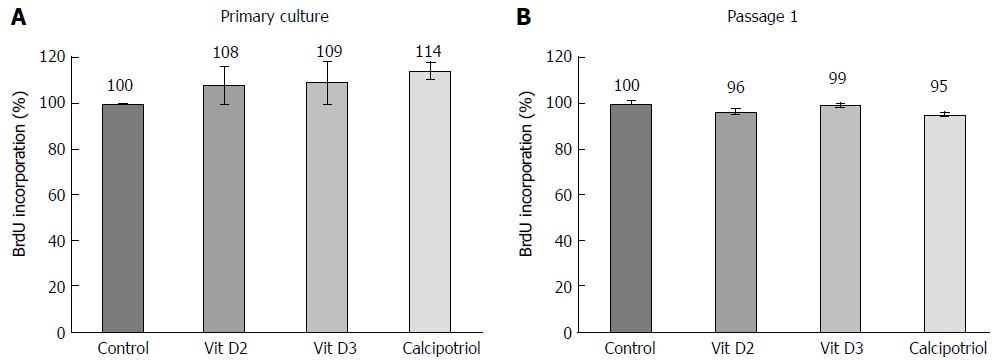
Figure 4 D-vitamins have no effect on DNA synthesis of pancreatic stellate cells.
Pancreatic stellate cells (PSCs) (A) in primary culture (days 1-4) and (B) of passage 1 (days 1-3) were challenged with D-vitamins at 100 nmol/L each, and DNA synthesis was assessed employing the BrdU incorporation assay. One hundred percent BrdU incorporation corresponds to solvent-treated PSCs. Data are expressed as mean ± SE (n ≥ 6 independent samples).
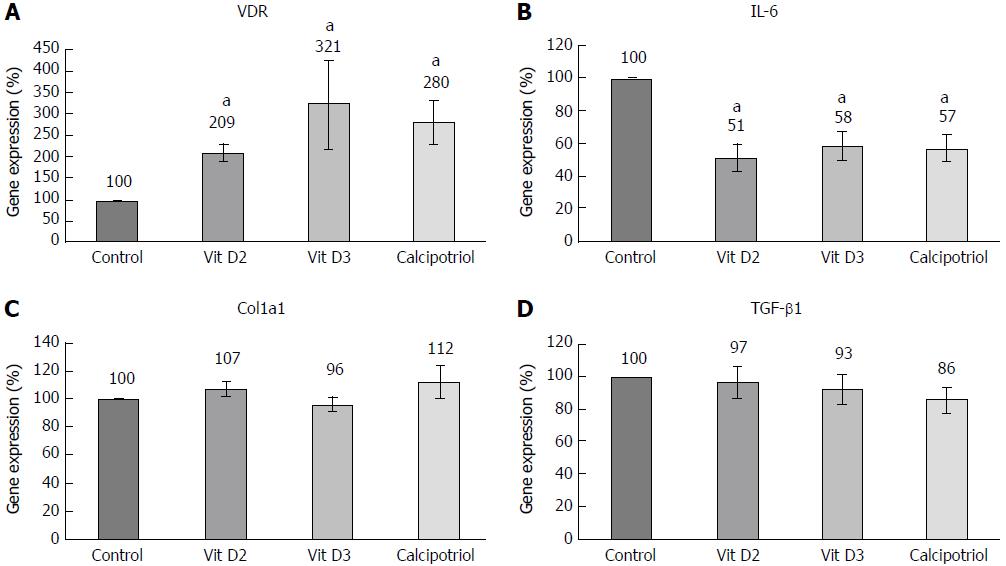
Figure 5 Effects of D-vitamins on pancreatic stellate cell gene expression (A-D).
Pancreatic stellate cells of the first passage were treated for 48 h with the indicated D-vitamins at 100 nmol/L each. Subsequently, the mRNA expression of the indicated genes and the house-keeping control Hprt was analyzed by real-time PCR, and relative amounts of target mRNA were calculated as described in the methods section. One hundred percent mRNA expression of each gene corresponds to untreated cells. Data are presented as averaged mean ± SE (n ≥ 8 independent samples). aP < 0.05 vs untreated controls.
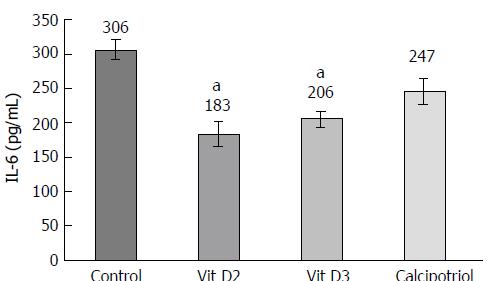
Figure 6 D-vitamins reduce interleukin-6 secretion.
Pancreatic stellate cells of the first passage were incubated for 24 h with D-vitamins (at 100 nmol/L each) as indicated. Subsequently, interleukin-6 (IL-6) protein levels in cell culture supernatants were analyzed by ELISA. Mean values and SE were calculated from 6 independent samples. aP < 0.05 vs untreated controls. For calcipotriol, the Bonferroni-adjusted P-value was 0.141.
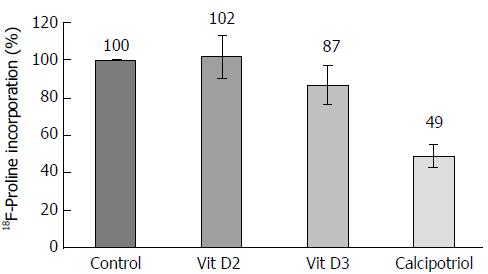
Figure 7 Effects of D-vitamins on 18F-proline incorporation.
Pancreatic stellate cells were treated for 48 h with the indicated D-vitamins at 100 nmol/L each. Afterwards, incorporation of 18F-proline was determined as described in the materials and methods section. Raw data were normalized to the protein content of the samples. One hundred percent 18F-proline incorporation corresponds to untreated PSCs. Data are expressed as mean ± SE (n = 5 samples). PFriedman test = 0.007, but no statistically significant differences between treated cells and the control group.
- Citation: Wallbaum P, Rohde S, Ehlers L, Lange F, Hohn A, Bergner C, Schwarzenböck SM, Krause BJ, Jaster R. Antifibrogenic effects of vitamin D derivatives on mouse pancreatic stellate cells. World J Gastroenterol 2018; 24(2): 170-178
- URL: https://www.wjgnet.com/1007-9327/full/v24/i2/170.htm
- DOI: https://dx.doi.org/10.3748/wjg.v24.i2.170


