Copyright
©The Author(s) 2018.
World J Gastroenterol. May 21, 2018; 24(19): 2120-2129
Published online May 21, 2018. doi: 10.3748/wjg.v24.i19.2120
Published online May 21, 2018. doi: 10.3748/wjg.v24.i19.2120
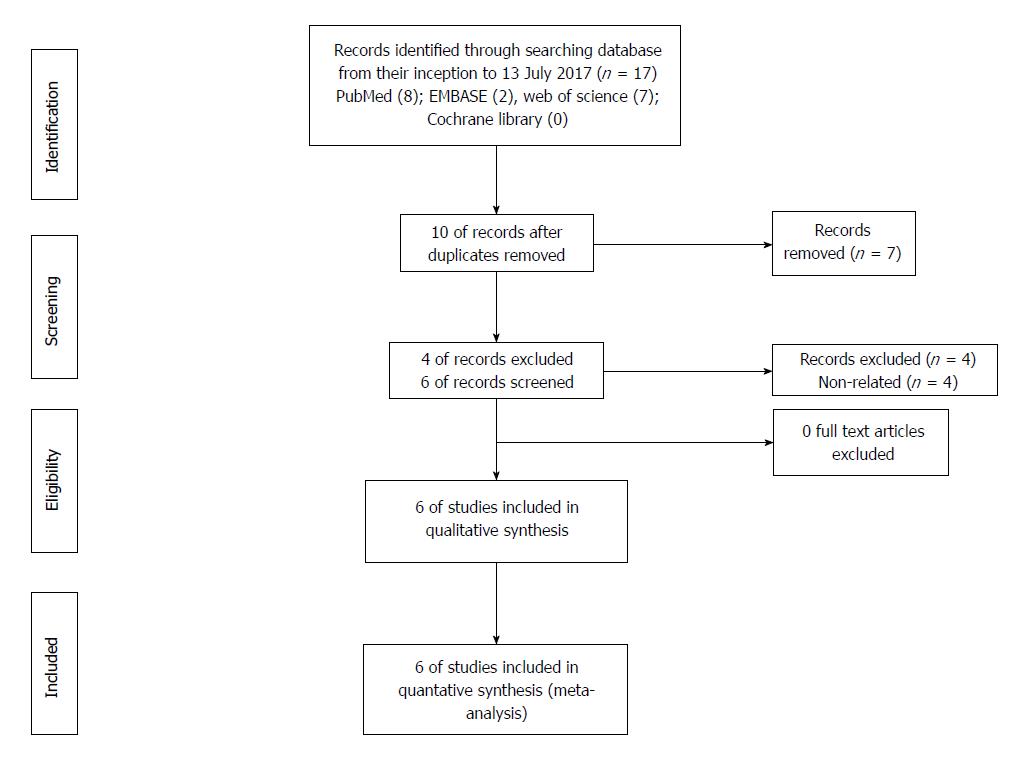
Figure 1 Methodological flow diagram of the meta-analysis.
Figure 2 Forest plots of studies evaluating HR with 95%CI of red cell distribution width for overall survival in esophageal cancer patients.
CI: Confidence interval; HR: Hazard ratio.
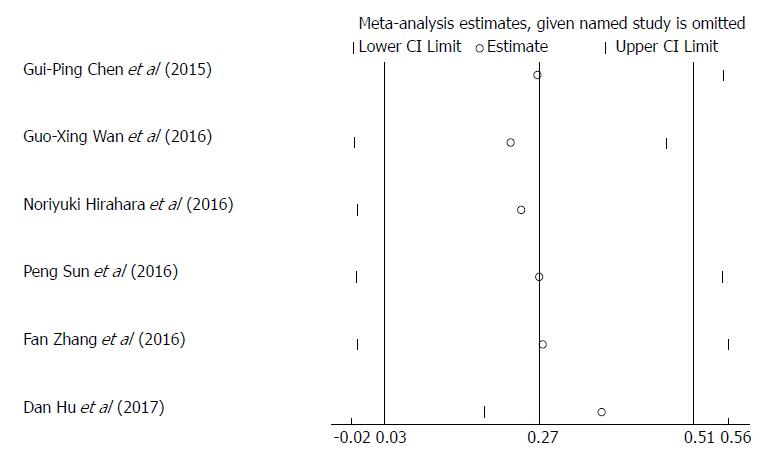
Figure 3 Effect of individual studies on the pooled HR for red cell distribution width and overall survival of esophageal cancer patients.
HR: Hazard ratio; RDW: Red cell distribution width.
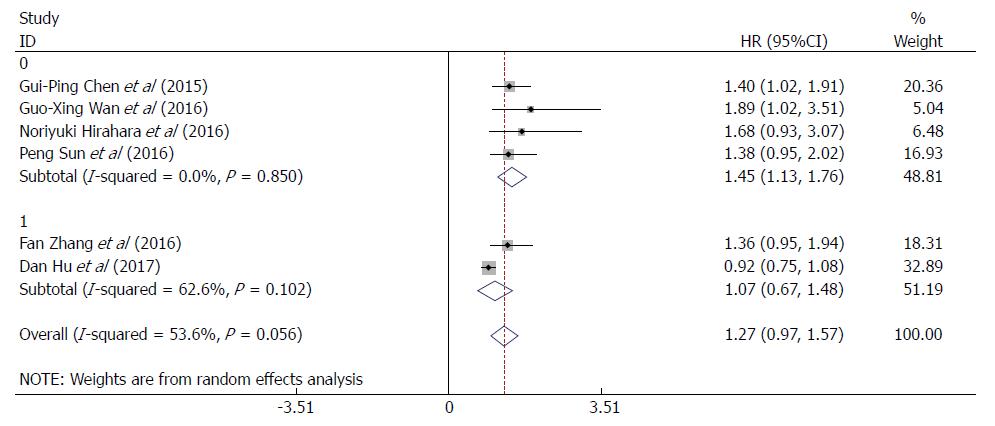
Figure 4 Forest plots of RDW > 13% vs RDW ≤ 13% evaluating HR with 95%CI of red cell distribution width for overall survival in esophageal cancer patients.
CI: Confidence interval; HR: Hazard ratio; RDW: Red cell distribution width. 0: RDW > 13%; 1: RDW ≤ 13%.
- Citation: Xu WY, Yang XB, Wang WQ, Bai Y, Long JY, Lin JZ, Xiong JP, Zheng YC, He XD, Zhao HT, Sang XT. Prognostic impact of the red cell distribution width in esophageal cancer patients: A systematic review and meta-analysis. World J Gastroenterol 2018; 24(19): 2120-2129
- URL: https://www.wjgnet.com/1007-9327/full/v24/i19/2120.htm
- DOI: https://dx.doi.org/10.3748/wjg.v24.i19.2120


