Copyright
©The Author(s) 2018.
World J Gastroenterol. May 7, 2018; 24(17): 1901-1910
Published online May 7, 2018. doi: 10.3748/wjg.v24.i17.1901
Published online May 7, 2018. doi: 10.3748/wjg.v24.i17.1901
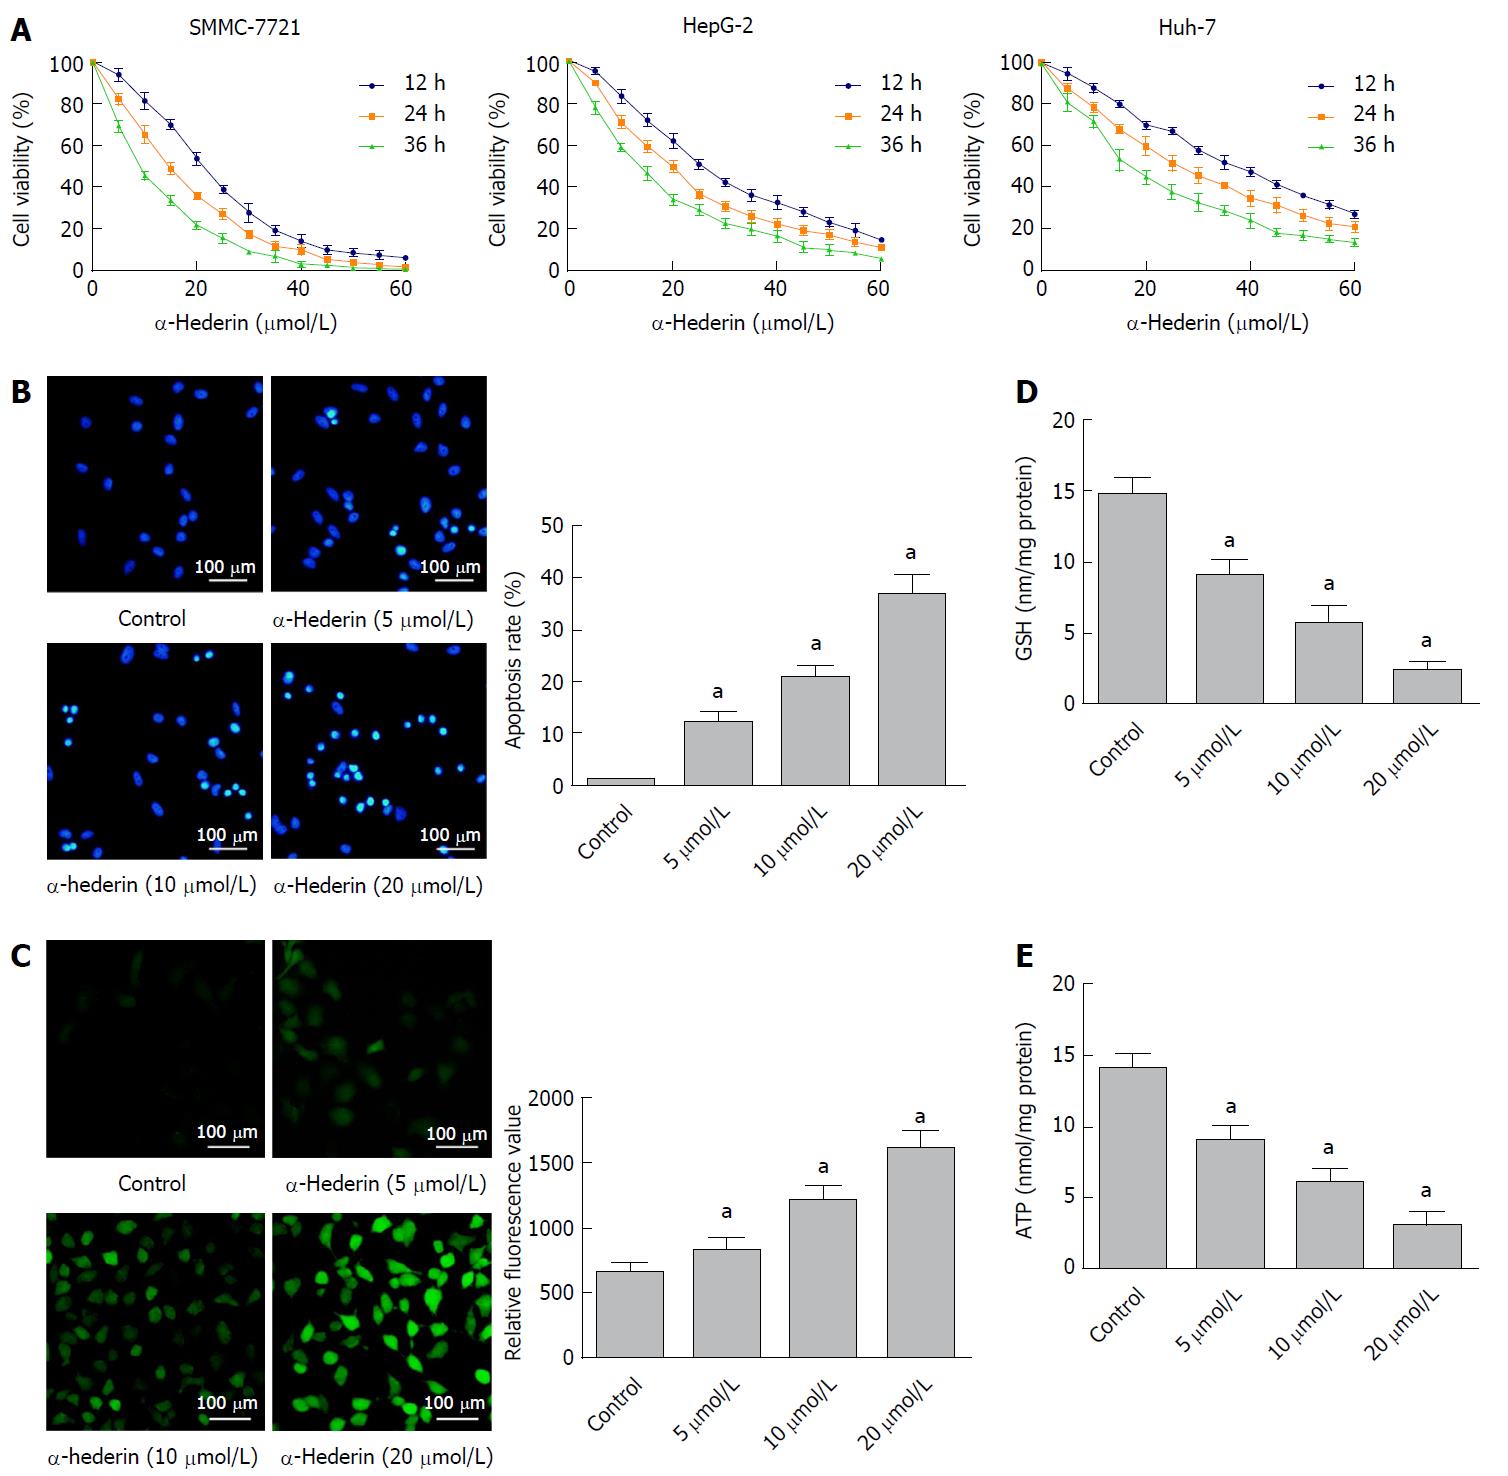
Figure 1 α-hederin reduces hepatocellular carcinoma cell viability and induces the apoptosis of hepatocellular carcinoma cells through GSH depletion and reactive oxygen species accumulation.
A: Cell Counting Kit-8 assays showed that α-hederin inhibits the viability of hepatocellular carcinoma cells (SMMC-7721, HepG-2, and Huh-7) in a dose- and time-dependent manner; B: SMMC-7721 cells were incubated with α-hederin (0, 5 μmol/L, 10 μmol/L, or 20 μmol/L) and stained with Hoechst 33258. Apoptotic cells were identified by fragmented and condensed nuclei under a fluorescence microscope. The percentage of apoptotic cells was calculated, P for trend < 0.01; C: SMMC-7721 cells were incubated with α-hederin (0, 5 μmol/L, 10 μmol/L, or 20 μmol/L), followed by incubation with DCFH-DA and observation under a fluorescence microscope or measurement using a microplate reader, P for trend < 0.01; D and E: SMMC-7721 cells were treated with α-hederin (0, 5 μmol/L, 10 μmol/L, or 20 μmol/L). GSH and ATP levels were measured using GSH and ATP Assay Kits and a microplate reader, P for trend < 0.01. aP < 0.05 vs control. ATP: adenosine triphosphate; GSH: Glutathione; ROS: Reactive oxygen species.
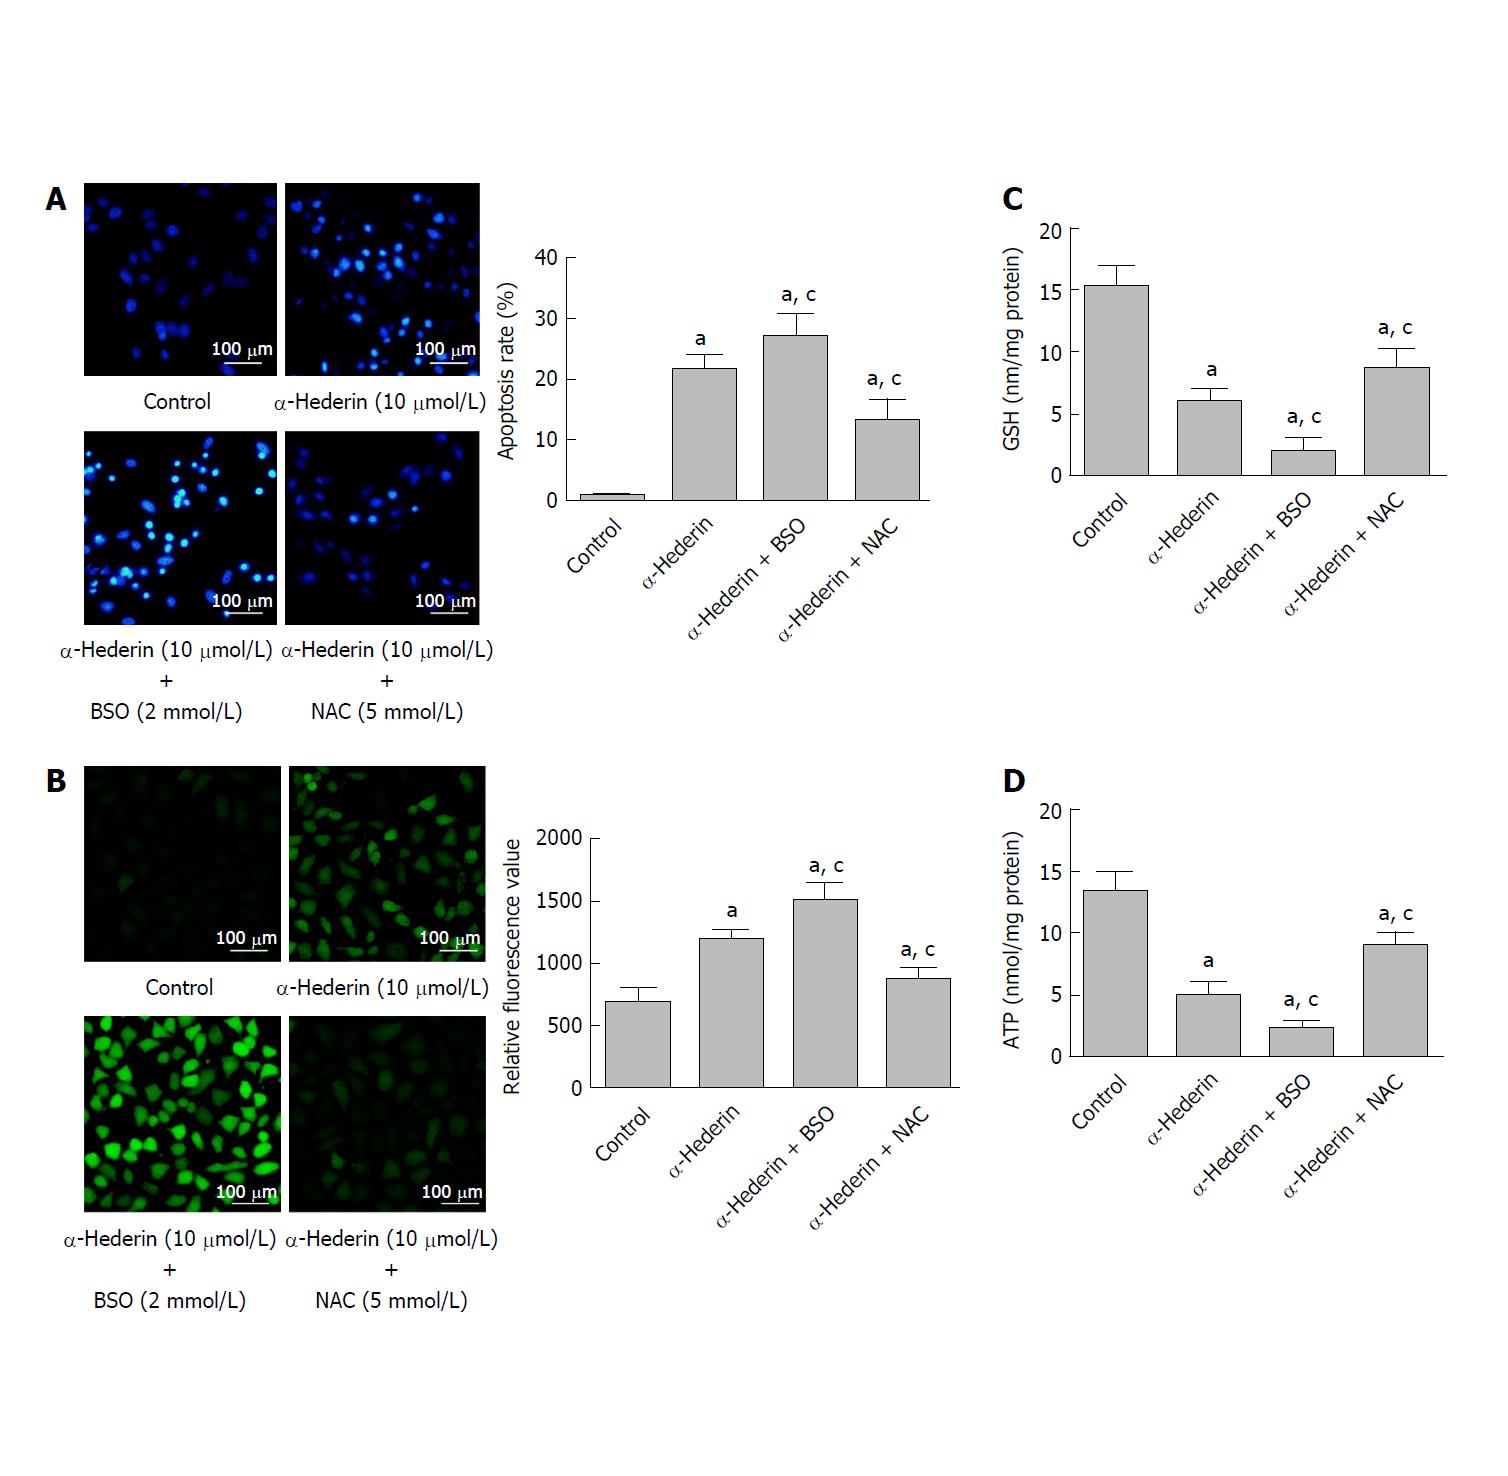
Figure 2 BSO and NAC influence the α-hederin-induced apoptosis of SMMC-7721 cells.
SMMC-7721 cells were incubated with α-hederin (10 μmol/L) with or without BSO (2 mmol/L) or NAC (5 mmol/L) pretreatment. A: Cell apoptosis was determined by Hoechst 33258 staining; B: ROS levels in SMMC-7721 cells; C and D: Effect of α-hederin on intracellular GSH and ATP levels. aP < 0.05 vs control; cP < 0.05 vs α-hederin (10 μmol/L). ATP: adenosine triphosphate; BSO: DL-buthionine-S,R-sulfoximine; GSH: Glutathione; NAC: N-acetylcysteine.
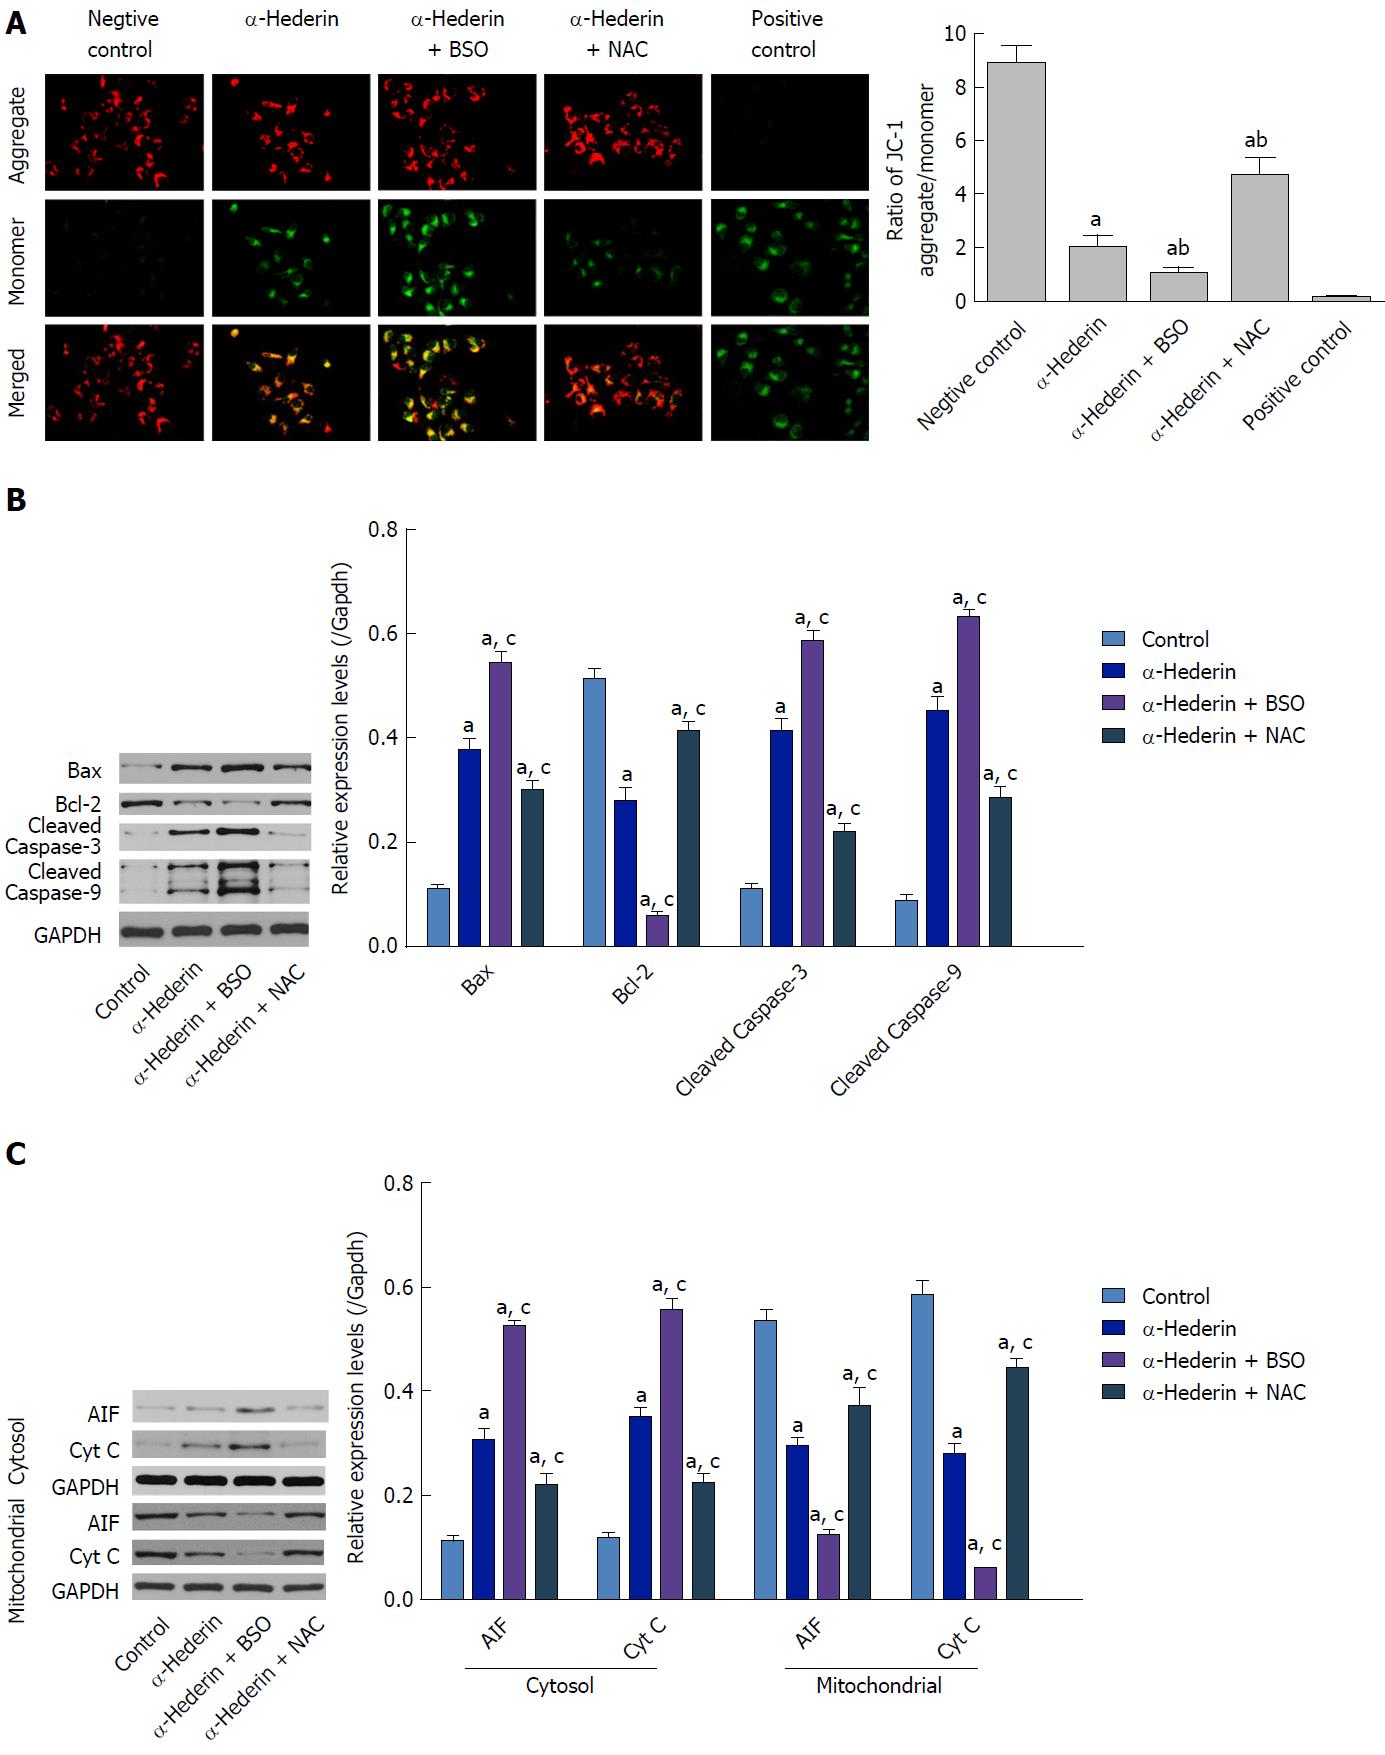
Figure 3 α-hederin induces apoptosis through activation of the mitochondria-mediated pathway.
A: Mitochondrial membrane potential was detected with JC-1. JC-1 aggregates (red fluorescence) under conditions of a normal mitochondrial membrane and forms a monomer (green fluorescence) under depolarizing conditions. Fluorescence was detected by a confocal laser scanning microscope (400 ×); B and C: Western blots showing the expression of mitochondrial pathway-related proteins in vitro. SMMC-7721 cells were treated with α-hederin (0 or 10 μmol/L) with or without BSO (2 mmol/L) or NAC (5 mmol/L) pretreatment, and the protein levels of Bcl-2, Bax, caspase-9, caspase-3, AIF, and Cyt C in SMMC-7721 cells were then detected by western blotting. GAPDH expression was used as an internal control. The relative expression levels of these proteins in SMMC-7721 cells in different groups were compared. aP < 0.05 vs control; cP < 0.05 vs α-hederin (10 μmol/L). AIF: Apoptosis-inducing factor; ATP: adenosine triphosphate; BSO: DL-buthionine-S,R-sulfoximine; Cyt C: Cytochrome C; NAC: N-acetylcysteine.
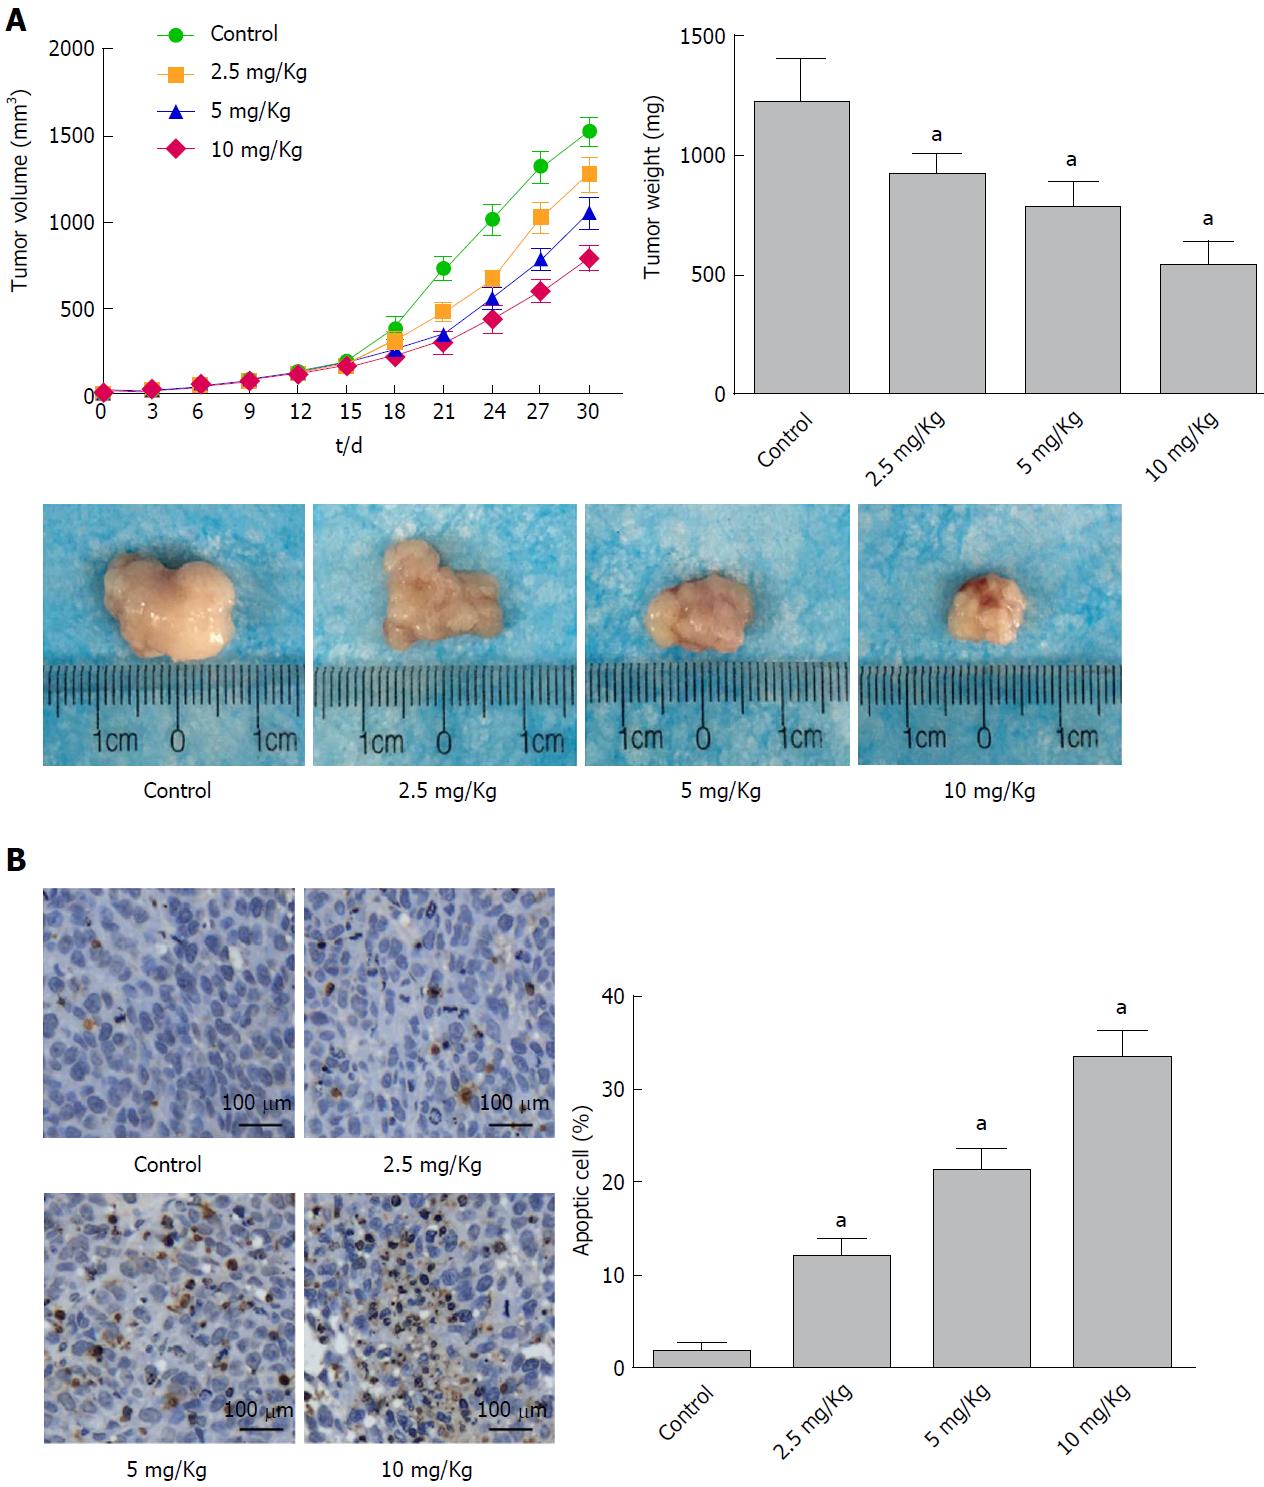
Figure 4 α-Hederin inhibits tumor growth in vivo.
Mice with xenograft tumors were divided into four groups (Control and 2.5 mg/kg, 5 mg/kg and 10 mg/kg α-Hederin, n = 6 mice per group). A: Mean tumor volume at each time point and final tumor weight, P for trend < 0.05; B: TUNEL assays detected apoptotic cells in xenograft tumor tissue, as evidenced by the presence of nut-brown nuclei under a fluorescence microscope. The percentage of apoptotic cells was calculated, P for trend < 0.05. aP < 0.05 vs control.
- Citation: Li J, Wu DD, Zhang JX, Wang J, Ma JJ, Hu X, Dong WG. Mitochondrial pathway mediated by reactive oxygen species involvement in α-hederin-induced apoptosis in hepatocellular carcinoma cells. World J Gastroenterol 2018; 24(17): 1901-1910
- URL: https://www.wjgnet.com/1007-9327/full/v24/i17/1901.htm
- DOI: https://dx.doi.org/10.3748/wjg.v24.i17.1901


