Copyright
©The Author(s) 2017.
World J Gastroenterol. Dec 21, 2017; 23(47): 8334-8344
Published online Dec 21, 2017. doi: 10.3748/wjg.v23.i47.8334
Published online Dec 21, 2017. doi: 10.3748/wjg.v23.i47.8334
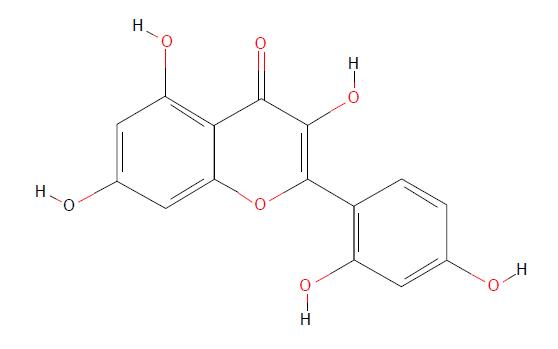
Figure 1 Chemical structure of morin.
(https://pubchem.ncbi.nlm.nih.gov/compound/morin).
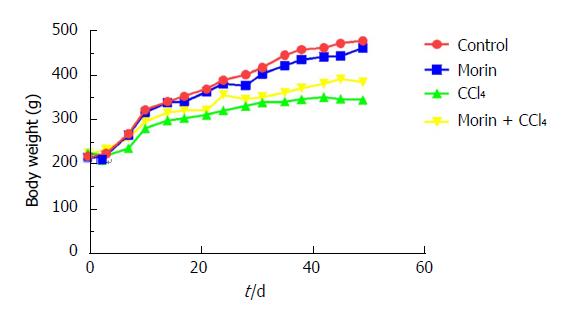
Figure 2 Changes in body weight among different groups.
Body weight increased observably in the control and morin groups. The CCl4 group had slow weight growth, but morin treatment was associated with increased body weight.
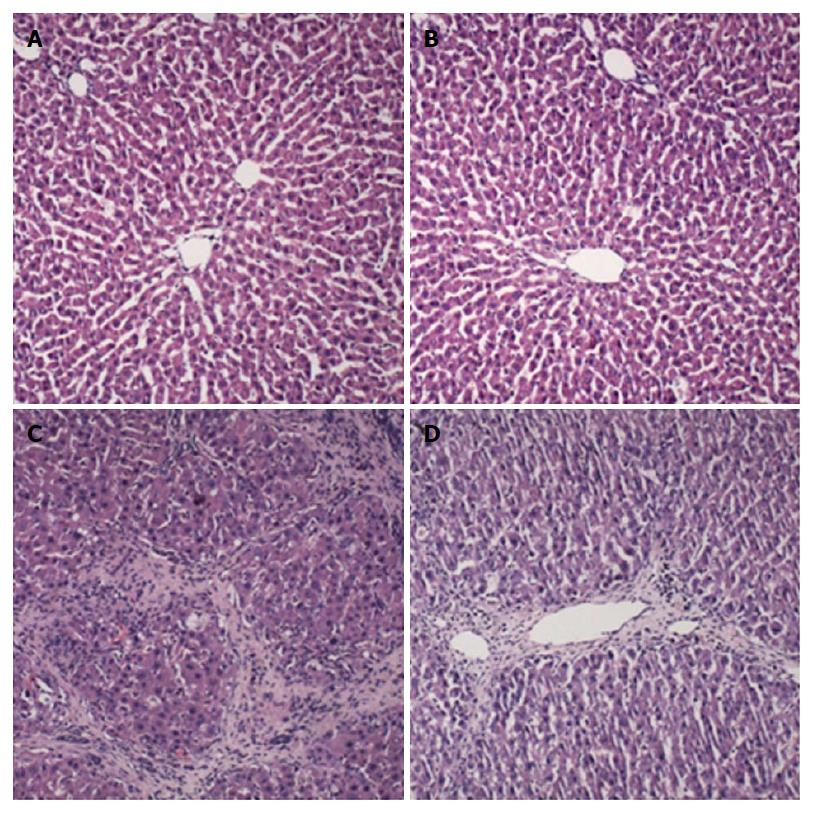
Figure 3 Histological changes of liver samples.
A: Control group: treated with vehicle only; B: Morin group: treated with morin at a dose of 50 mg/kg twice a week; C: CCl4 group: injected with CCl4 at a dose of 2 mL/kg twice a week; D: Morin + CCl4 group: treated with the same volume of morin and CCl4 as the morin and CCl4 groups. Liver tissues were stained with H&E (× 100).
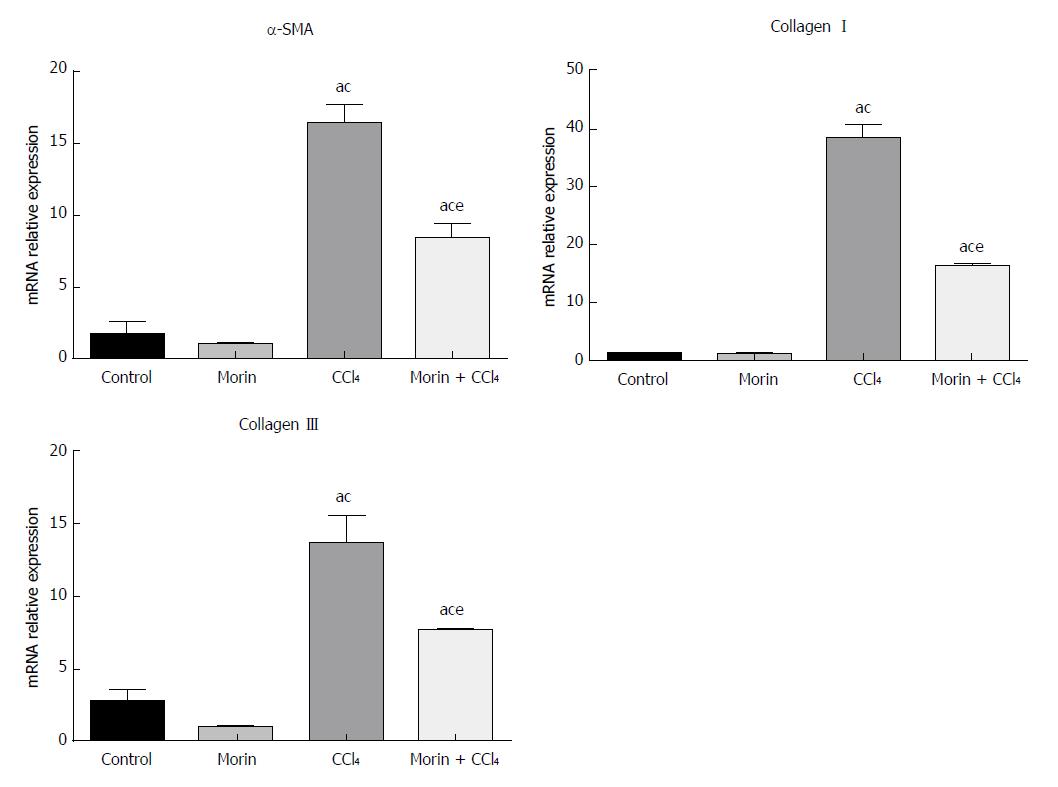
Figure 4 The mRNA expression of α-SMA, collagen I, and collagen III.
aP < 0.05 vs control group, cP < 0.05 vs morin group, eP < 0.05 vs CCl4 group. In the control and morin groups, there was only minimal expression. The CCl4 and morin + CCl4 groups showed significantly increased expression (P < 0.05), while the expression levels in the morin + CCl4 group were lower than those of the CCl4 group (P < 0.05).
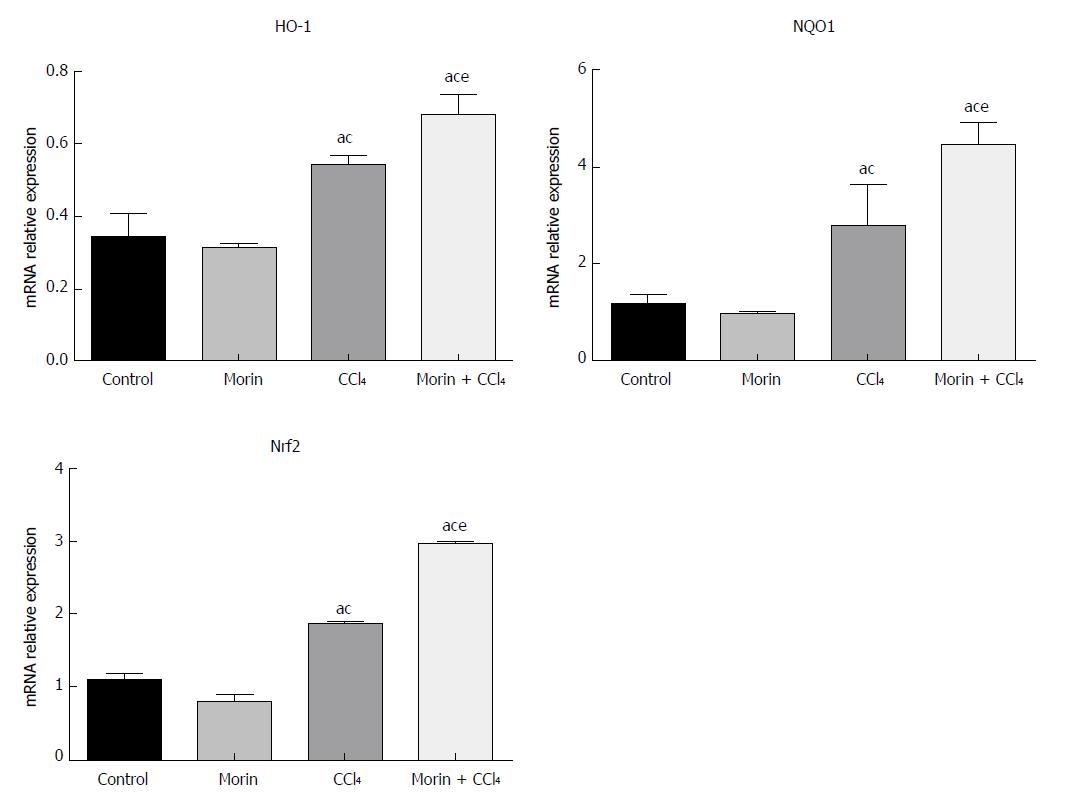
Figure 5 The mRNA expression of HO-1, NQO1, and Nrf2.
aP < 0.05 vs control group, cP < 0.05 vs morin group, eP < 0.05 vs CCl4 group. The expression was increased obviously in the CCl4 and morin + CCl4 groups compared to the control and morin groups (P < 0.05). The expression levels in the morin + CCl4 group were significantly higher than those of the CCl4 group (P < 0.05).
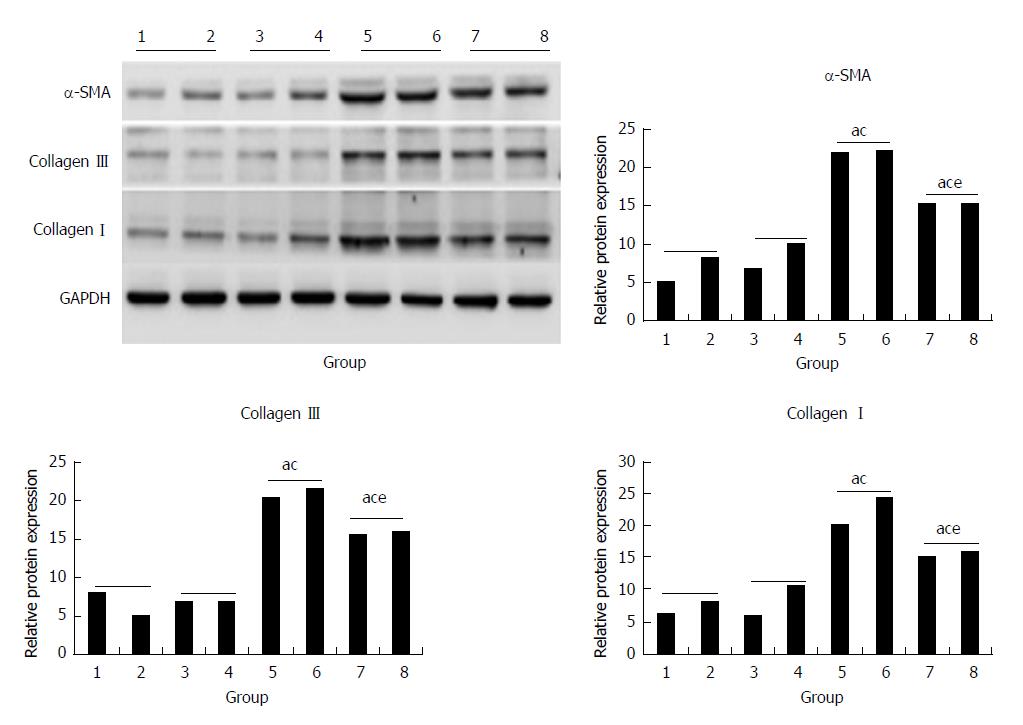
Figure 6 The protein expression of α-SMA, collagen III, and collagen I.
(1, 2) control group, (3, 4) morin group, (5, 6) CCl4 group, (7, 8) morin + CCl4 group. aP < 0.05 vs control group, cP < 0.05 vs morin group, eP < 0.05 vs CCl4 group. The CCl4 and morin + CCl4 groups showed significantly increased expression compared to the control and morin groups (P < 0.05), and the expression levels in the morin + CCl4 group were lower than those in the CCl4 group (P < 0.05).
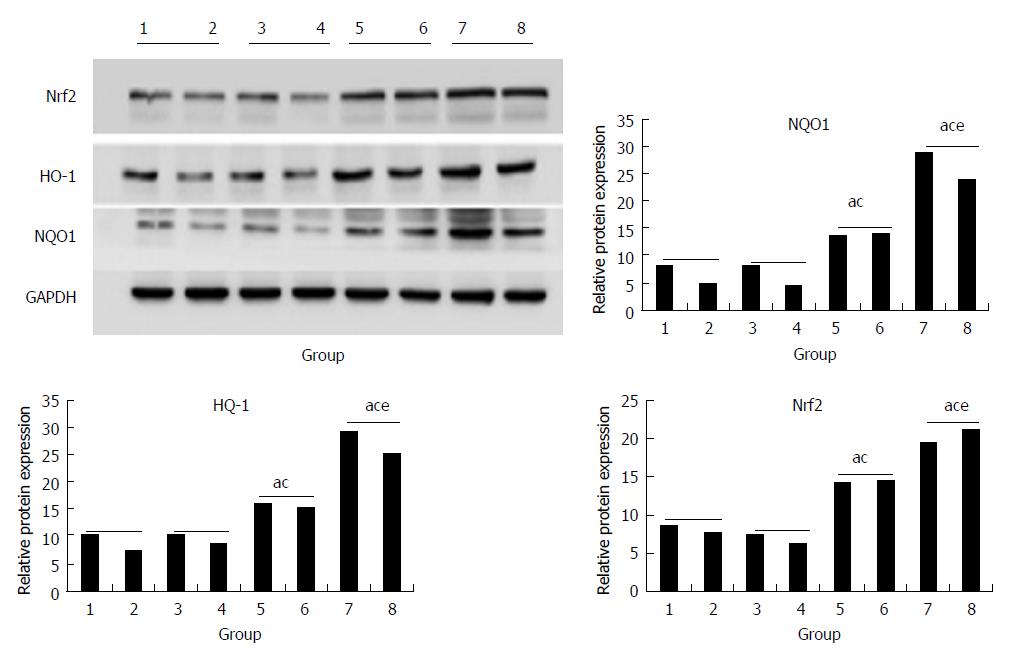
Figure 7 The protein expression of Nrf2, HO-1, and NQO1.
(1, 2) control group, (3, 4) morin group, (5, 6) CCl4 group, (7, 8) morin + CCl4 group. aP < 0.05 vs control group, cP < 0.05 vs morin group, eP < 0.05 vs CCl4 group. In the CCl4 and morin + CCl4 groups, the protein expression was increased compared to the control and morin groups (P < 0.05); the morin + CCl4 group had a more significant change compared to the CCl4 group (P < 0.05).
- Citation: Sang L, Wang XM, Xu DY, Sang LX, Han Y, Jiang LY. Morin enhances hepatic Nrf2 expression in a liver fibrosis rat model. World J Gastroenterol 2017; 23(47): 8334-8344
- URL: https://www.wjgnet.com/1007-9327/full/v23/i47/8334.htm
- DOI: https://dx.doi.org/10.3748/wjg.v23.i47.8334


