Copyright
©The Author(s) 2017.
World J Gastroenterol. Nov 14, 2017; 23(42): 7626-7634
Published online Nov 14, 2017. doi: 10.3748/wjg.v23.i42.7626
Published online Nov 14, 2017. doi: 10.3748/wjg.v23.i42.7626
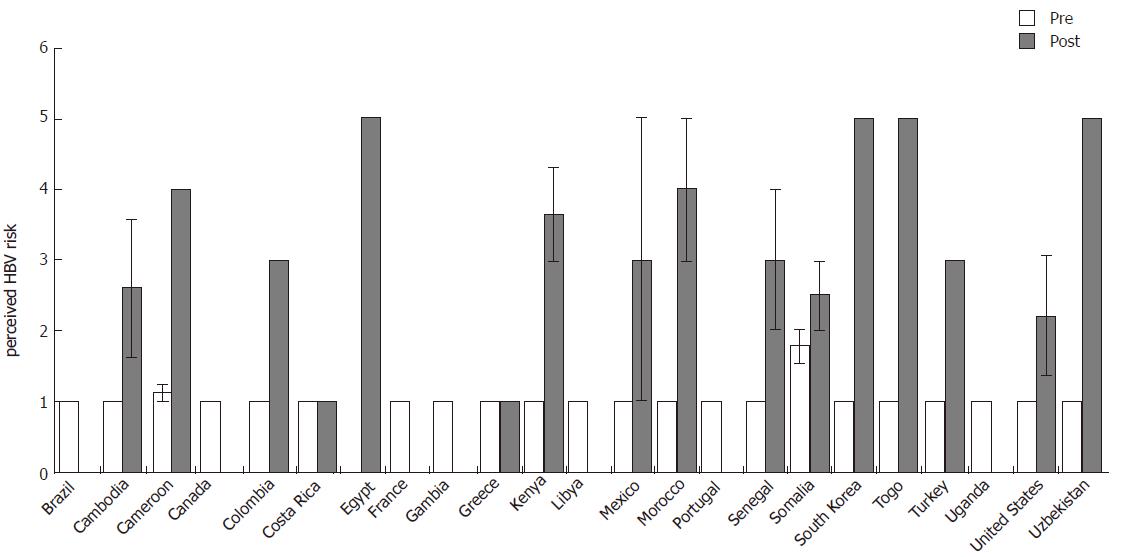
Figure 1 Perceived hepatitis B virus risk by country: responses to “How high is your risk for having hepatitis B infection, on a scale of 1 to 5?” In the pre session, 98 participants answered this question with a mean response score of 1.
33. In the post session, 53 participants answered and a mean response score of 3.13 was obtained. There is a statistically significant increase in the perceived risk of hepatitis B with aP value of < 0.05.
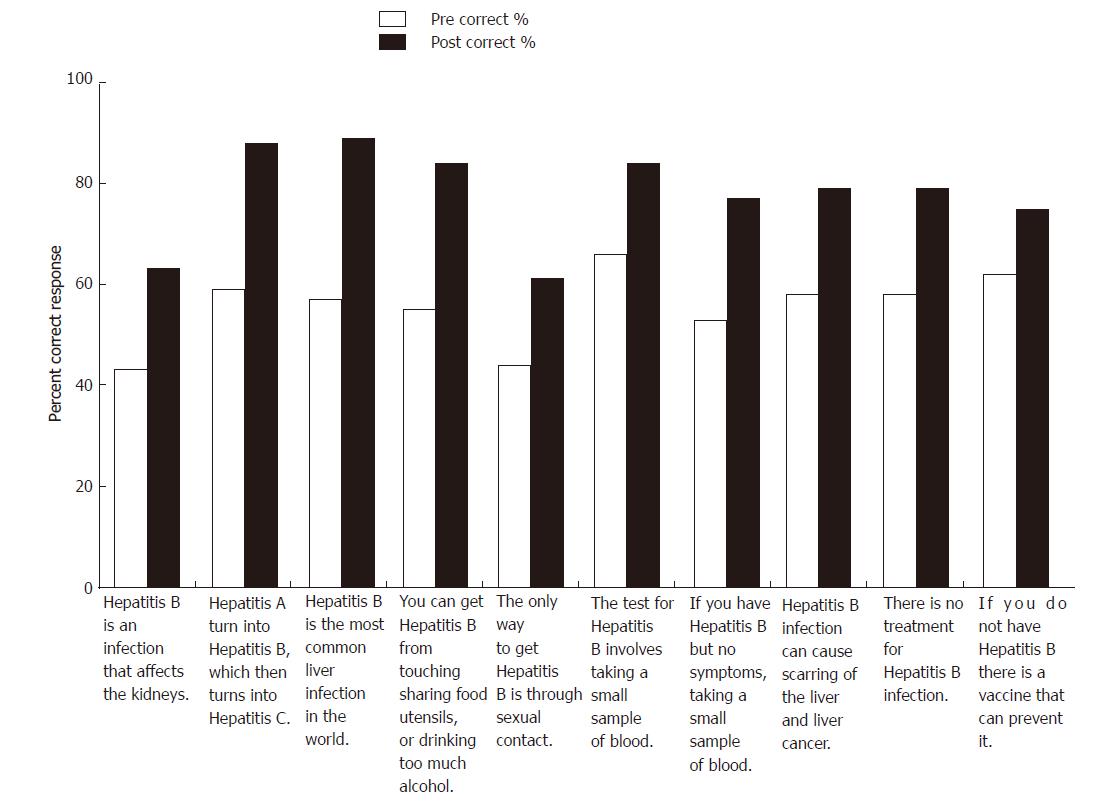
Figure 2 Responses to true/false questions.
Participants were asked to answer a series of true/false questions prior to (Pre) and following (Post) the teaching session. The percentage of correct responses to true/false questions increased, following the teaching session, for all questions.
- Citation: Djoufack R, Cheon SSY, Mohamed A, Faye F, Diouf K, Colvin R, Morrill J, Duffy-Keane AM, Perumalswami P, Jourdain G, Fusco D. Hepatitis B virus outreach to immigrant population in Greater Boston Area: Key to improving hepatitis B knowledge. World J Gastroenterol 2017; 23(42): 7626-7634
- URL: https://www.wjgnet.com/1007-9327/full/v23/i42/7626.htm
- DOI: https://dx.doi.org/10.3748/wjg.v23.i42.7626


