Copyright
©The Author(s) 2017.
World J Gastroenterol. Jan 28, 2017; 23(4): 603-613
Published online Jan 28, 2017. doi: 10.3748/wjg.v23.i4.603
Published online Jan 28, 2017. doi: 10.3748/wjg.v23.i4.603
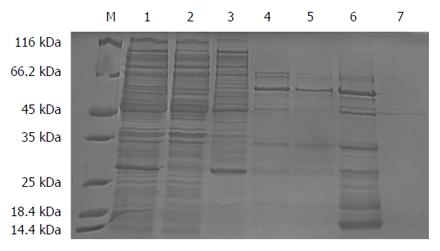
Figure 1 SDS-PAGE (10%) analysis for nickel agarose affinity chromatography purification of fusion protein.
A new protein band with a molecular weight of approximately 55 kDa appeared in the 500 mmol/L imidazole elution fractions. M: Protein marker; 1: Sample; 2: Outflow; 3: 20 mmol/L Imidazole elution fractions; 4, 5: 50 mmol/L Imidazole elution fractions; 6, 7: 500 mmol/L Imidazole elution fractions.
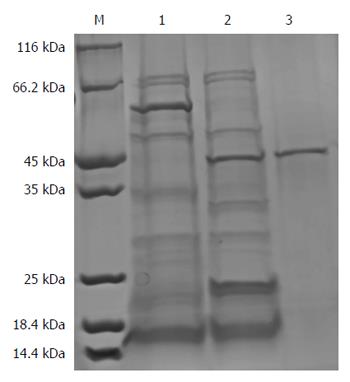
Figure 2 SDS-PAGE (10%) analysis for nickel agarose affinity chromatography purification of fusion protein after TEV digestion.
A protein band of about 42 kDa appeared after the new protein was cut by TEV enzyme. M: Protein marker: 1: Before TEV digestion; 2: After TEV digestion (sample); 3: Outflow.
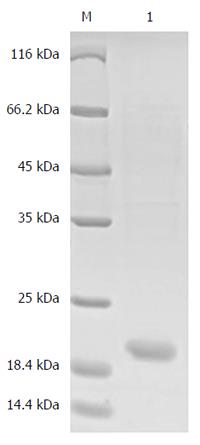
Figure 3 SDS-PAGE (10%) analysis of proBFT-2 hydrolysis using trypsin.
A new protein band with a molecular of 20 kDa appeared after the protein was digested with trypsin. M: Protein marker; 10 μg/mL trypsin hydrolyzes proBFT-2 at 37 °C for 1 h.
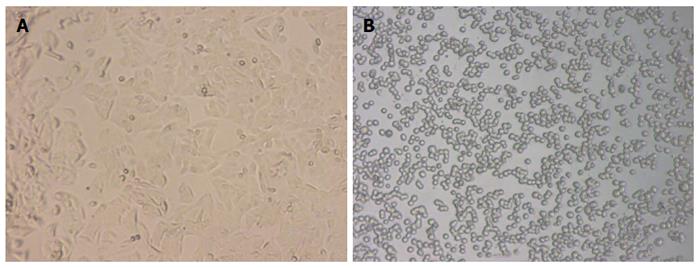
Figure 4 Before BFT-2 treatment (A) and after BFT-2 treatment (B).
SW-480, which grows adherently in a fusiform shape under a normal condition, showed cell rounding and separating from each other after treatment with BFT-2.
Figure 5 General status of mice in each group.
BC: Normal; AD: Rectal prolapse; ADLT: Tumor prolapse; ADHT: Bloody stools, intestinal obstruction.
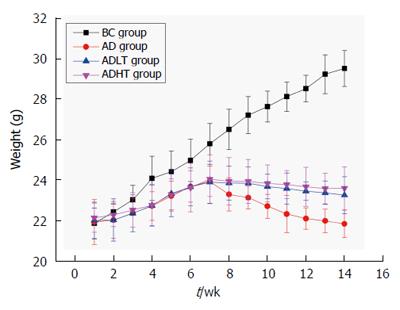
Figure 6 Alteration of body weight of mice of each group.
Body weight of the mice in the BC group showed a steady growth. Significant decline appeared in the AD group since 8 wk, compared with the ADLT and ADHT groups. At 14 wk, the body weight of mice in the BC group was 29.48 ± 0.88 g, in the AD group was 21.82 ± 0.68 g, in the ADLT group was 23.23 ± 0.91 g, and in the ADHT group was 23.57 ± 1.06 g. AD vs ADLT, P = 0.006; AD vs ADHT, P = 0.002; ADLT vs ADHT, P = 0.632.
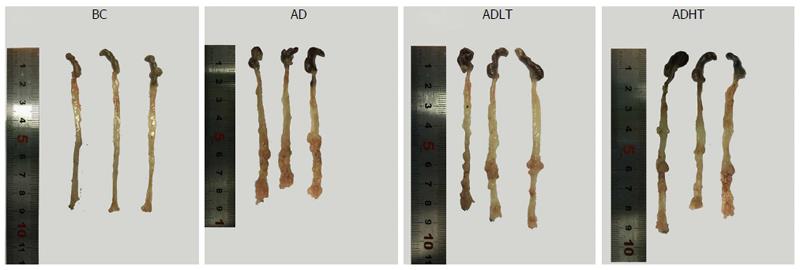
Figure 7 Comparison of the samples in vitro of the large intestine of mice from each group.
All the mice in the BC group showed no occurrence of the formation of tumors. In the AD group, the ADLT group and the ADHT group, multiple tumors of different sizes were found on the mucosal surface and located in the distal site of the large intestine and the anal canal, which were accompanied by different degrees of colon shortening.
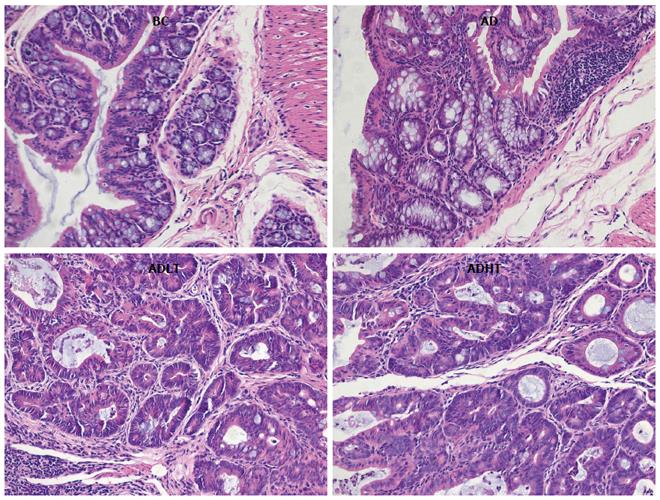
Figure 8 Comparison of the tissue of the large intestine of mice from each group.
HE staining, magnification × 200.
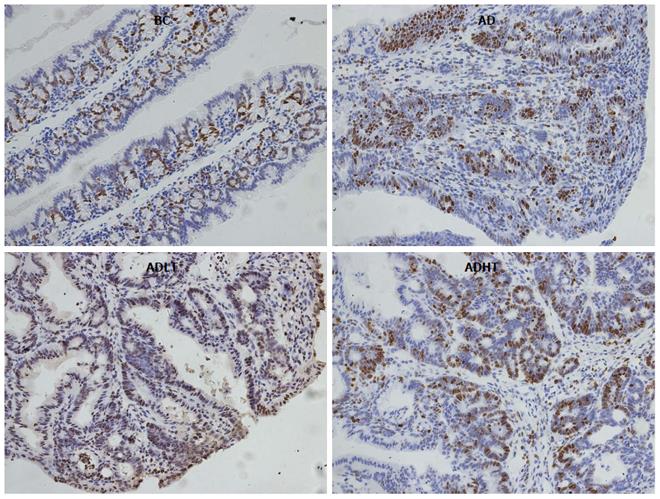
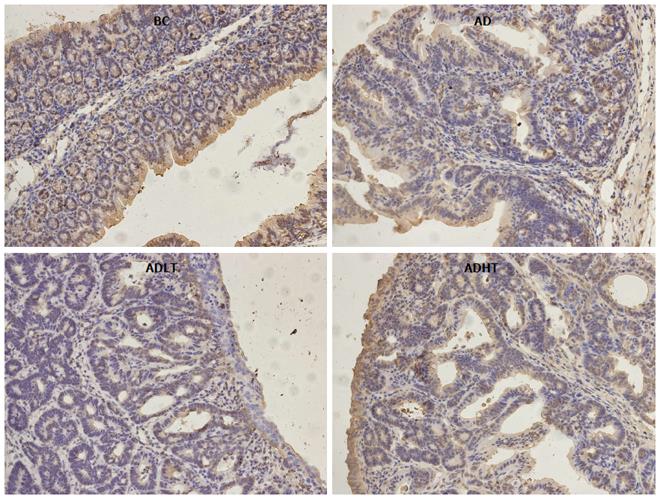
Figure 9 Expression of Ki-67 in the large intestine of mice from each group.
SP staining, magnification × 200.
Figure 10 Expression of Caspase-3 in the large intestine of mice from each group.
SP staining, magnification × 200.
- Citation: Lv Y, Ye T, Wang HP, Zhao JY, Chen WJ, Wang X, Shen CX, Wu YB, Cai YK. Suppression of colorectal tumorigenesis by recombinant Bacteroides fragilis enterotoxin-2 in vivo. World J Gastroenterol 2017; 23(4): 603-613
- URL: https://www.wjgnet.com/1007-9327/full/v23/i4/603.htm
- DOI: https://dx.doi.org/10.3748/wjg.v23.i4.603


