©The Author(s) 2017.
World J Gastroenterol. Sep 28, 2017; 23(36): 6650-6664
Published online Sep 28, 2017. doi: 10.3748/wjg.v23.i36.6650
Published online Sep 28, 2017. doi: 10.3748/wjg.v23.i36.6650
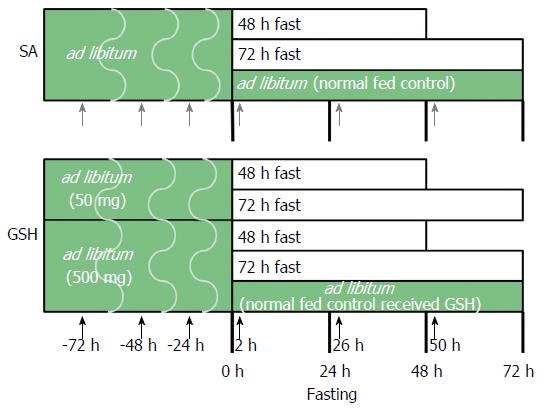
Figure 1 Experimental design.
Rats were divided into eight groups, one of which was fed ad libitum, another of which was fed ad libitum and received oral glutathione (GSH), and six of which were administered saline (SA) or GSH orally prior to and after fasting. The large block arrows represent treatment with SA (closed gray arrow) and GSH (closed block arrow).
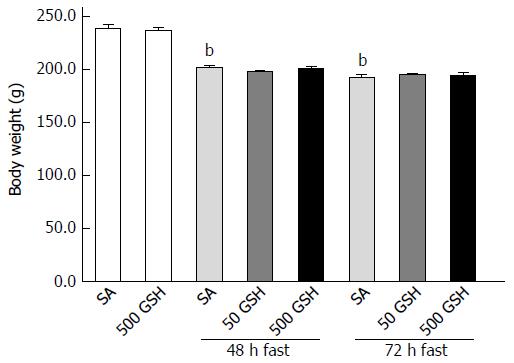
Figure 2 Effects of fasting and glutathione treatment on body weight.
Fasting caused gradual decreases in body weight in both SA- and GSH-treated groups. There was no difference in weight loss between the GSH treatments and the respective SA-treated groups in each fasting period. Values represent the mean ± SE. bP < 0.01 vs the normally fed control. 7-8 rats were tested in each group. GSH: Glutathione; SA: Saline.
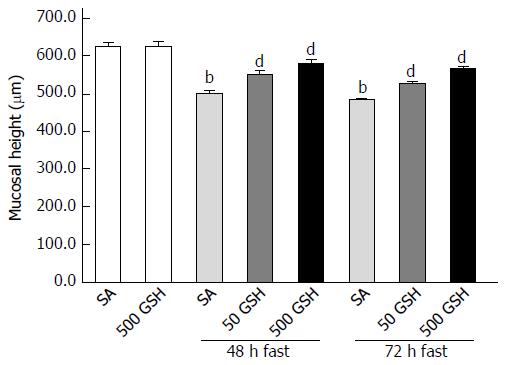
Figure 3 Effects of fasting and glutathione treatment on jejunal mucosal atrophy.
Jejunal mucosal atrophy was assessed by jejunal mucosal height. Values represent the mean ± SE. bP < 0.01 vs the normally fed control. dP < 0.01 vs the respective SA-treated group in each fasting period. 7-8 rats were tested in each group. GSH: Glutathione; SA: Saline.
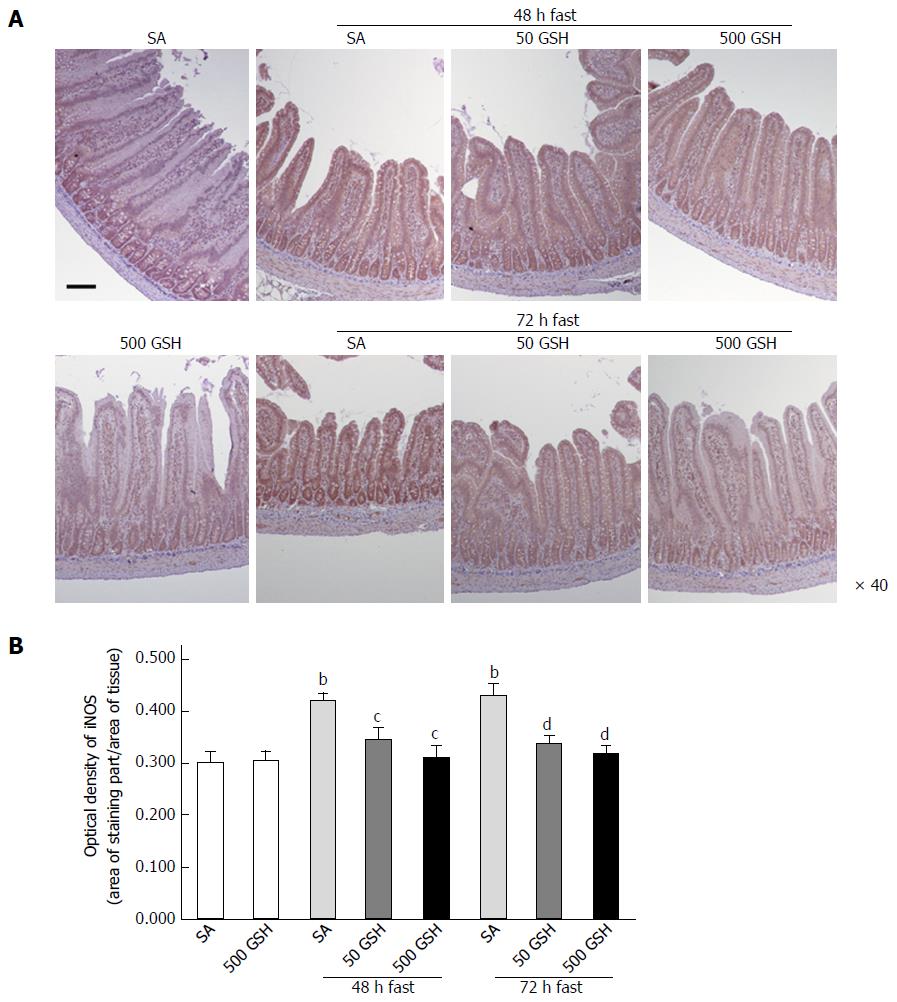
Figure 4 Effects of fasting and glutathione treatment on inducible nitric oxide synthase protein expression in the jejunum.
A: Light micrographs of immunohistochemical staining for iNOS. In SA-treated groups, iNOS protein staining was localized almost exclusively in the mucosal epithelial monolayer with 48 and 72 h of fasting compared with the normally fed control. Decreased staining occurred with GSH treatment. Bar = 100 μm. B: Optical density of iNOS protein. The content of iNOS protein was quantitatively measured by averaging the optical density. Values represent the mean ± SE. bP < 0.01 vs normally fed controls. dP < 0.01, cP < 0.05 vs the respective SA group in each fasting period. 7-8 rats were tested in each group. GSH: Glutathione; SA: Saline; iNOS: Inducible nitric oxide synthase.
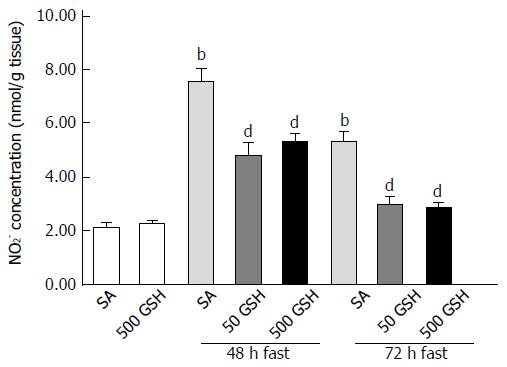
Figure 5 Effects of fasting and glutathione treatment on nitrite concentration in the jejunum.
Nitrite concentrations were measured by HPLC using postcolumn derivatization with Griess reagent. Values represent the mean ± SE. bP < 0.01 vs the SA-treated group. dP < 0.01 vs the respective SA-treated group in each fasting period. 7-8 rats were tested in each group. GSH: Glutathione; SA: Saline.
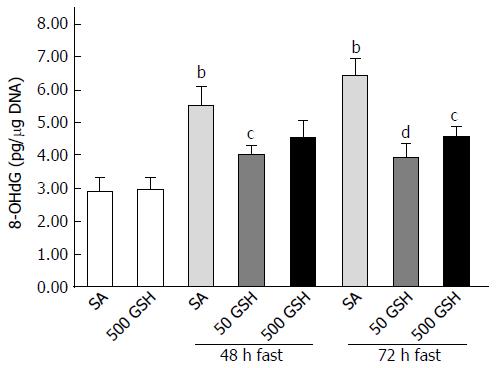
Figure 6 Effects of fasting and glutathione treatment on DNA oxidative damage in the jejunum.
DNA oxidative damage was assessed by the level of 8-hydroxydeoxyguanosine (8-OHdG) in the jejunum. Values represent the mean ± SE. bP < 0.01 vs the normally fed control. dP < 0.01, cP < 0.05 vs the SA-treated group with 48 and 72 h of fasting. 7-8 rats were tested in each group. GSH: Glutathione; SA: Saline.
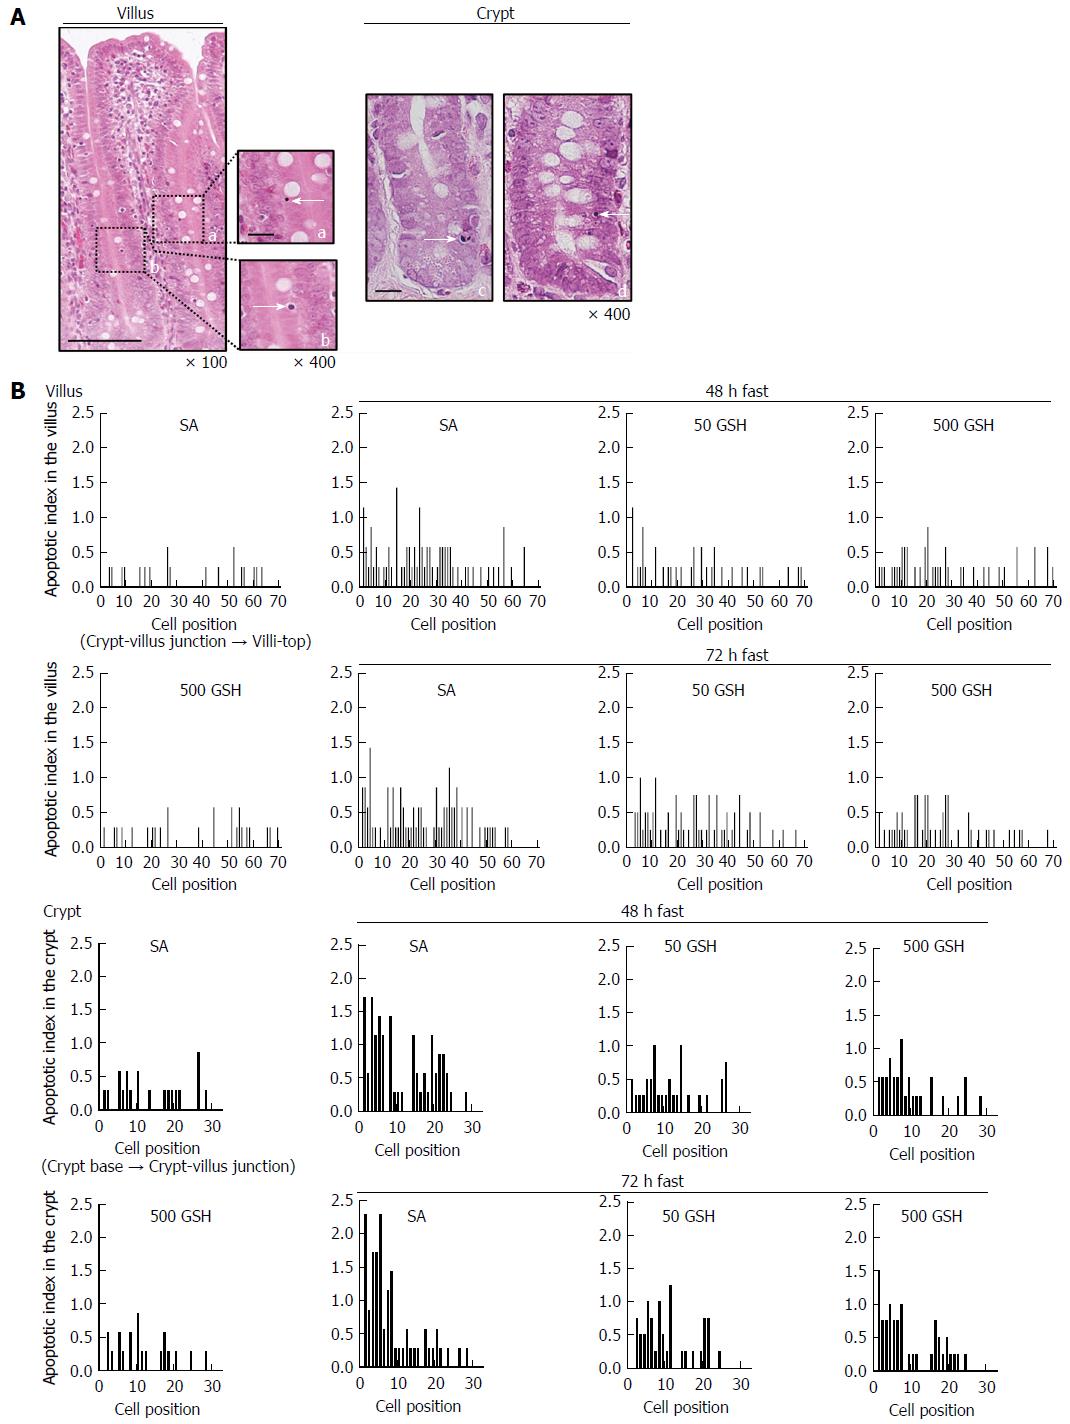
Figure 7 Effects of fasting and glutathione treatment on apoptotic index in the jejunal villus and crypt.
Representative apoptotic changes determined by conventional light microscopy of hematoxylin and eosin (HE)-stained sections of the jejunal mucosa are shown in A. Left side: A jejunal villus from a 72-h fasted rat with 500 mg/kg GSH treatment. Apoptotic cells in the villus are indicated by an arrow showing an apoptotic corpuscle (a) and condensed chromatin (b). Bar = 100 μm (low magnification). Bar = 20 μm (high magnification). Right side: Jejunal crypts from 48- and 72-h fasted rats. Apoptotic cells in the crypt are indicated by an arrow showing an intensely eosinophilic cytoplasm and nuclear fragmentation (c) and condensed chromatin (d). Bar = 20 μm. AI distribution curves in the villus and the crypt are shown in B. AI is defined as the total number of apoptotic cells at each cell position and is expressed as a percentage of the total number of cells counted at that cell position. Cell position 1 is defined as the cell at the crypt-villus junction and the cell at the base of the crypt column for the villus and crypt data, respectively. 7-8 rats were tested in each group. GSH: Glutathione; SA: Saline.
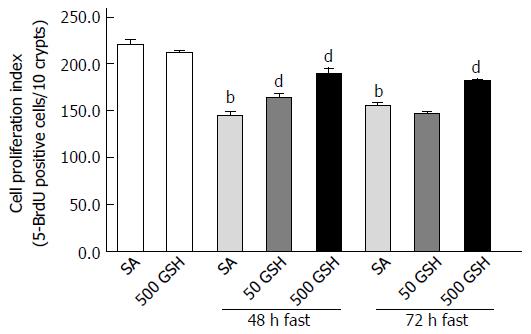
Figure 8 Effects of fasting and glutathione treatment on cell proliferation in the jejunum.
Cell proliferation in the jejunal crypt was histologically assessed by 5-bromo-2’-deoxyuridine (5-BrdU) incorporation. The fraction of 5-BrdU-positive cells was expressed as the cell proliferation index (5-BrdU-positive cells/10 crypts). Values represent the mean ± SE. bP < 0.01 vs the normally fed control. dP < 0.01 vs the respective SA-treated group in each fasting period. 7-8 rats were tested in each group. GSH: Glutathione; SA: Saline.
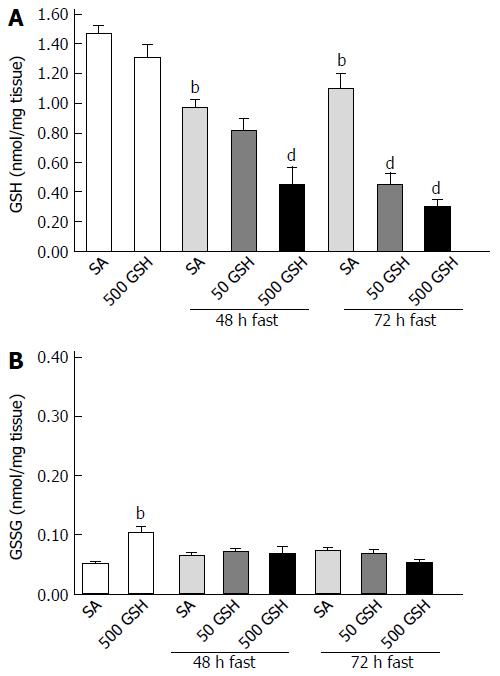
Figure 9 Effects of fasting and glutathione treatment on glutathione and oxidized glutathione concentration in the jejunum.
GSH and GSSG concentration in the jejunum was determined by measuring the absorption derived from a colorimetric reaction with DTNB [5, 5’-dithiobis (2-nitrobenzoic acid)] coupled with the enzymatic recycling system. A: GSH concentration in the jejunum; B: GSSG concentration in the jejunum. Values are the mean ± SE. bP < 0.01 vs the normally fed control. dP < 0.01 vs the respective SA-treated group in each fasting period. 7-8 rats were tested in each group. GSH: Glutathione; SA: Saline; GSSG: Oxidized glutathione.
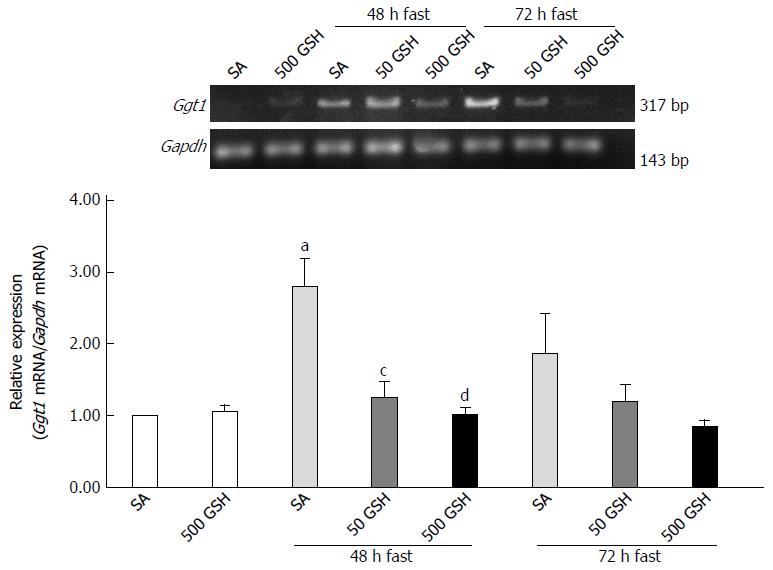
Figure 10 Effects of fasting and glutathione treatment on Ggt1 mRNA expression in the jejunum.
GGT is the only enzyme of the gamma-glutamyl cycle located on the outer surface of plasma membrane and plays key roles in GSH homeostasis by breaking down extracellular GSH. Values are the mean ± SE. aP < 0.05 vs the normally fed control. dP < 0.01, cP < 0.05 vs the SA-treated group with 48 h of fasting. 7-8 rats were tested in each group. GSH: Glutathione; SA: Saline; GSSG: Oxidized glutathione.
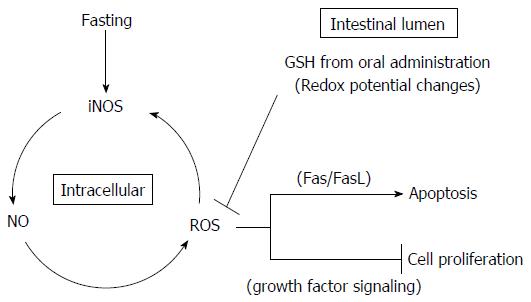
Figure 11 Schematic diagram of protective effects of glutathione in the intestinal lumen against fasting-induced intestinal atrophy, mediated through oxidative stress.
The schematic diagram depicts a possible role of intestinal lumen redox status in the regulation of jejunal mucosa apoptosis and cell proliferation in fasting-induced intestinal atrophy, mediated through oxidative stress. Fasting causes increased production of NO and ROS as apoptosis mediators following elevation of iNOS expression. The changes in apoptosis and cell proliferation in the intestinal mucosa resulting from oral GSH administration during fasting may derive from intracellular ROS removal by redox potential changes mediated by GSH and Cys (originating from enzymatic hydrolysis of GSH) in the intestinal lumen. Intracellular ROS removal is considered to inhibit Fas-mediated apoptosis and increase growth factor-mediated cell proliferation. GSH: Glutathione; ROS: Reactive oxygen species.
- Citation: Uchida H, Nakajima Y, Ohtake K, Ito J, Morita M, Kamimura A, Kobayashi J. Protective effects of oral glutathione on fasting-induced intestinal atrophy through oxidative stress. World J Gastroenterol 2017; 23(36): 6650-6664
- URL: https://www.wjgnet.com/1007-9327/full/v23/i36/6650.htm
- DOI: https://dx.doi.org/10.3748/wjg.v23.i36.6650


