Copyright
©The Author(s) 2017.
World J Gastroenterol. Aug 14, 2017; 23(30): 5519-5529
Published online Aug 14, 2017. doi: 10.3748/wjg.v23.i30.5519
Published online Aug 14, 2017. doi: 10.3748/wjg.v23.i30.5519
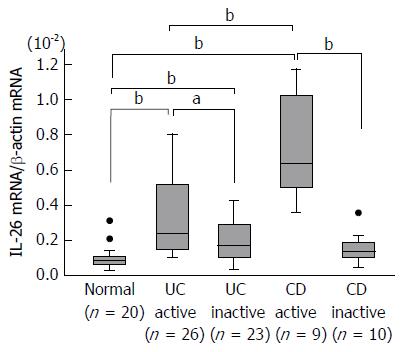
Figure 1 Expression of interleukin-26 mRNA in the inflamed mucosa of patients with inflammatory bowel disease.
Total RNA was extracted from biopsied samples, and the mRNA expression of IL-26 was evaluated using real-time PCR. IL-26 mRNA expression was converted to a value relative to β-actin mRNA expression and presented as fold-increase relative to the results for normal mucosa. Data are expressed as mean ± SE. Normal mucosa, n = 20; active UC, n = 26; inactive UC, n = 23; active CD, n = 9; inactive CD, n = 10. aP < 0.05 UC active vs UC inactive, bP < 0.01 Normal vs UC active, Normal vs UC inactive, Normal vs CD active, UC active vs CD active, CD active vs CD inactive. IL: Interleukin; CD: Crohn’s disease; UC: Ulcerative colitis.
Figure 2 Immunohistochemical analyses of interleukin-26 in the inflamed mucosa of inflammatory bowel disease patients.
A: Immunostaining for IL-26 in normal mucosa and inflamed mucosa of UC and CD. Pictures are shown from one of four independent samples with similar results. Magnification; upper panel × 200, lower panel × 400; B: Dual-colored immunofluorescence was used to determine the expression of IL-26 (green fluorescence) and CD4, CD56 and CD68 (red fluorescence) in inflamed mucosa of UC patients. Double-positive cells were detected by yellow fluorescence. Pictures are shown from one of four independent samples with similar results. IL: Interleukin; CD: Crohn’s disease; UC: Ulcerative colitis.
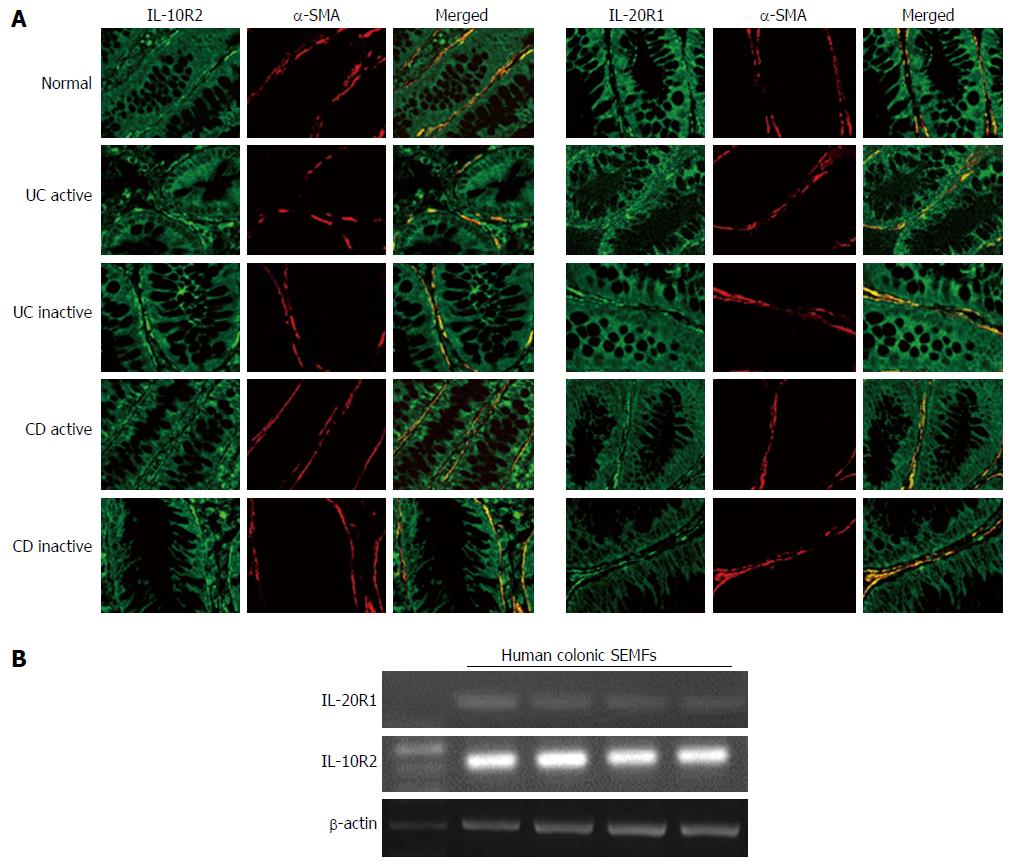
Figure 3 Immunohistochemical analyses of interleukin-26 receptor expression in normal and active/inactive inflammatory bowel disease mucosa.
A: Dual-colored immunofluorescence was used to localize α-SMA (red fluorescence) and IL-26 receptor, IL-10R2 and IL-20R1 (green fluorescence). Dual positive immunostaining can be seen as yellow fluorescence in the merged images. Pictures are shown from one of four independent samples with similar results. Magnification × 200; B: The expression of IL-26 receptor in human colonic SEMFs isolated from four different surgical samples. The expression of IL-26 receptor was evaluated by RT-PCR. SMA: Smooth muscle actin; IL: Interleukin; SEMFs: Subepithelial myofibroblasts.
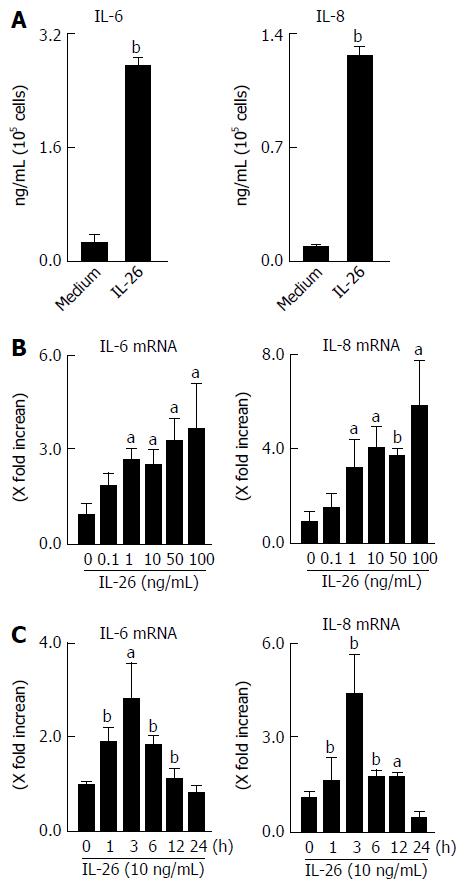
Figure 4 Secretion of interleukin-6 and interleukin-8 in response to interleukin-26 stimulation in human colonic subepithelial myofibroblasts.
A: The cells were stimulated for 12 h with 100 ng/mL of IL-26, and the secretion of IL-6 and IL-8 in supernatants were determined using ELISA; B: Dose-dependent effects of IL-26 on IL-6 and IL-8 mRNA expression. Cells were stimulated for 3 h with increasing concentrations of IL-26, and the mRNA expression of IL-6 and IL-8 was then determined using real-time PCR. The mRNA expression of IL-6 and IL-8 was converted to a value relative to β-actin mRNA expression and presented as fold-increase relative to the results for medium alone; C: The kinetics of IL-6 and IL-8 induction by IL-26. Human colonic SEMFs were stimulated with 100 ng/mL of IL-26 for the indicated predetermined times, and the mRNA expression of IL-6 and IL-8 was then determined using real-time PCR. The mRNA expression of IL-6 and IL-8 was converted to a value relative to β-actin mRNA expression and presented as fold-increase relative to the results for medium alone (no stimulation). Data are expressed as mean ± SE of four independent experiments. aP < 0.05, bP < 0.01 vs control. IL: Interleukin; SEMFs: Subepithelial myofibroblasts.
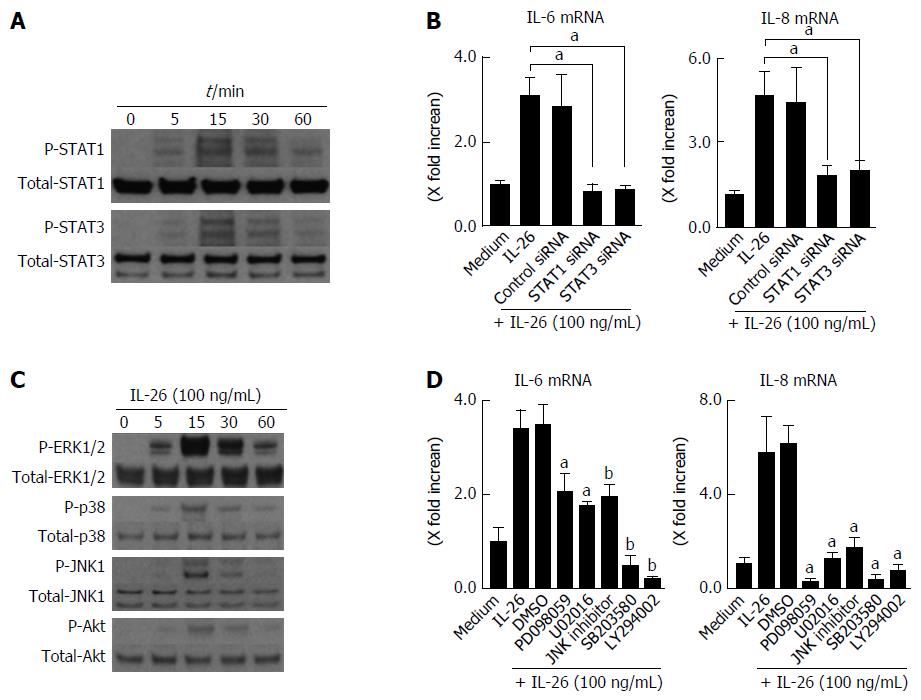
Figure 5 Involvement of STAT1, STAT3, MAPKs and PI3K/Akt activation in interleukin-26-stimulated interleukin-6 and interleukin-8 induction.
A: STAT1 and STAT3 activation in response to IL-26. Human colonic SEMFs were stimulated with 100 ng/mL of IL-26 for the indicated pre-determined times, and the phosphorylation (P-) of STAT1 and STAT3 was evaluated by immunoblot analyses. The data are representative of two independent experiments; B: The effects of siRNAs for STAT1 and STAT3 on IL-26-induced mRNA expression of IL-6 and IL-8. Cells were transfected with siRNA for STAT1 and STAT3 or control siRNA, and were incubated for 3 h with or without 100 ng/mL of IL-26. The mRNA expression of IL-6 and IL-8 was then evaluated using real-time PCR. The mRNA expression of IL-6 and IL-8 was converted to a value relative to β-actin mRNA expression and presented as fold-increase relative to the results for medium alone (no stimulation); C: MAPKs and PI3K/Akt activation in response to IL-26. Human colonic SEMFs were stimulated with 100 ng/mL of IL-26 for the indicated pre-determined times, and the phosphorylation (P-) of MAPKs and PI3K was evaluated by immunoblot analyses. The data are representative of two independent experiments; D: Effects of inhibitors of MAPKs and PI3K/Akt on IL-6 and IL-8 induction by IL-26 in human colonic SEMFs. The cells were pretreated with 10 μmol/L of a p38 MAPK inhibitor (SB203580) or an MEK1/2 inhibitor (U0216 or PD098059), or with 3 μmol/L of a JNK inhibitor (JNK inhibitor I) or 25 μmol/L of a PI3K inhibitor (LY294002) for 30 min, and were then incubated with or without 100 ng/mL of IL-26 for 3 h. The mRNA expression of IL-6 and IL-8 was converted to a value relative to β-actin mRNA expression and presented as fold-increase relative to the results for medium alone. Data are expressed as mean ± SE of four independent experiments. aP < 0.05, bP < 0.01 vs IL-26 stimulation. IL: Interleukin; SEMFs: Subepithelial myofibroblasts.
Figure 6 Effect of siRNA.
A: Effect of siRNAs specific for STAT1 and STAT3 in human colonic subepithelial myofibroblasts. The cells were transfected with siRNAs specific for STAT1 and STAT3. A control siRNA was also used. The effect of siRNAs was evaluated using real-time PCR. The expression of STAT1 and STAT3 was significantly suppressed by specific siRNAs as compared to a control siRNA. STAT1 and STAT3 mRNA expression was converted to a value relative to β-actin mRNA expression and presented as fold-increase relative to the results for medium alone (no stimulation); B: Effect of siRNAs specific for NF-κBp65 and c-Jun (AP-1) in human colonic subepithelial myofibroblasts. The cells were transfected with siRNAs specific for NF-κBp65 and c-Jun (AP-1). A control siRNA was also used. The effect of siRNAs was evaluated using real-time PCR. The expression of NF-κBp65 and c-Jun (AP-1) was significantly suppressed by specific siRNAs as compared to a control siRNA. The mRNA expression of NF-κBp65 and c-Jun (AP-1) mRNA was converted to a value relative to β-actin mRNA expression and presented as fold-increase relative to the results for medium alone (no stimulation). Data are expressed as mean ± SE of four independent experiments. bP < 0.01 vs medium. n.s.: Not significant.
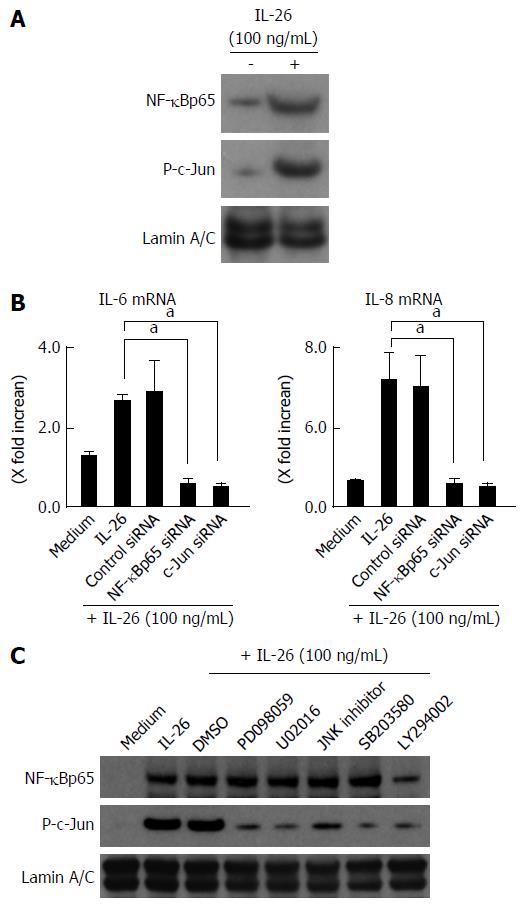
Figure 7 Involvement of nuclear factor-κB and AP-1 activation in the induction of inflammatory mediators induced by interleukin-26.
A: Activation of NF-B and AP-1 (c-Jun) in response to IL-26 in human colonic SEMFs. The cells were stimulated with 100 ng/mL of IL-26 for 15 min, following which nuclear proteins were extracted and analyzed by immunoblotting for NF-κB (p65) and phosphorylated (P-) c-Jun. Lamin A/C was used as a loading control. The data are representative of two individual experiments; B: The effects of siRNAs specific for NF-κBp65 and c-Jun (AP-1) on IL-26-induced expression of IL-6 and IL-8 in human colonic SEMFs. The cells were transfected with siRNA specific for NF-κBp65, c-Jun (AP-1) or a control siRNA, and were incubated for 24 h with or without 100 ng/mL of IL-26. The mRNA expression of IL-6 and IL-8 was evaluated using real-time PCR. The mRNA expression of IL-6 and IL-8 mRNA was converted to a value relative to β-actin mRNA expression and presented as fold-increase relative to the results for medium alone (no stimulation). Data are expressed as mean ± SE of four independent experiments. aP < 0.05 vs IL-26 stimulation; C: The effect of MAPKs and PI3K/Akt on the activation of NF-κBp65 and c-Jun (AP-1). The cells were pretreated with 10 μmol/L of a p38 MAPK inhibitor (SB203580) or an MEK1/2 inhibitor (U0216 or PD098059), or with 3 μmol/L of a JNK inhibitor (JNK inhibitor I) or 25 μmol/L of a PI3K inhibitor (LY294002) for 30 min, and were then incubated with or without 100 ng/mL of IL-26 for 15 min. Nuclear proteins were then extracted and analyzed by immunoblotting for NF-κBp65 and phosphorylated (P-) c-Jun. Lamin A/C was used as a loading control. The data are representative of two individual experiments. IL: Interleukin.
- Citation: Fujii M, Nishida A, Imaeda H, Ohno M, Nishino K, Sakai S, Inatomi O, Bamba S, Kawahara M, Shimizu T, Andoh A. Expression of Interleukin-26 is upregulated in inflammatory bowel disease. World J Gastroenterol 2017; 23(30): 5519-5529
- URL: https://www.wjgnet.com/1007-9327/full/v23/i30/5519.htm
- DOI: https://dx.doi.org/10.3748/wjg.v23.i30.5519


