©The Author(s) 2017.
World J Gastroenterol. Jul 21, 2017; 23(27): 4968-4977
Published online Jul 21, 2017. doi: 10.3748/wjg.v23.i27.4968
Published online Jul 21, 2017. doi: 10.3748/wjg.v23.i27.4968
Math 1 Math(A1).
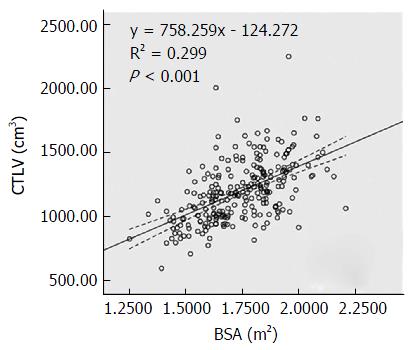
Figure 1 Correlation between computed tomography estimated total liver volume and body surface area of 244 healthy adults.
The 95%CI is shown (Dotted line). BSA: Body surface area; CTLV: Computed tomography estimated total liver volume.
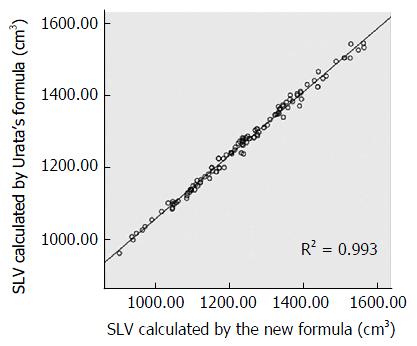
Figure 2 Correlation between standard liver volume calculated by the new formula and Urata’s formula.
SLV: Standard liver volume.
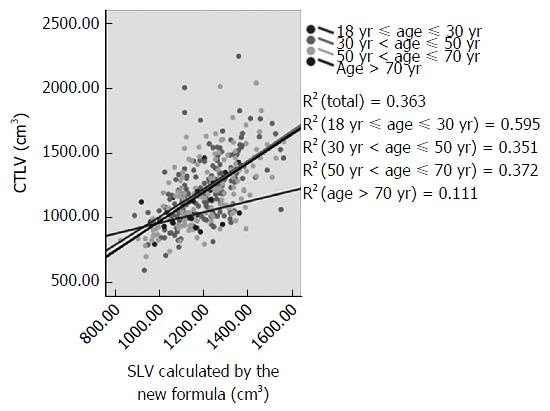
Figure 3 Correlation between standard liver volume calculated by the new formula and computed tomography estimated total liver volume stratified according to age.
CTLV: Computed tomography estimated total liver volume; SLV: Standard liver volume.
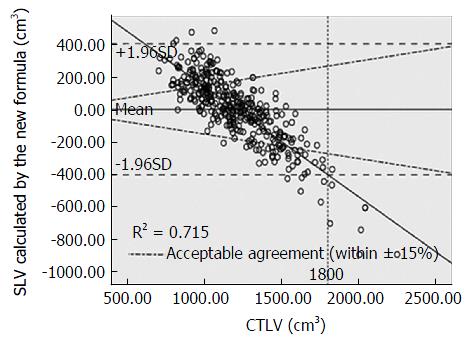
Figure 4 Modified Bland-Altman plots of the volume differences and computed tomography estimated total liver volume.
CTLV: Computed tomography estimated total liver volume; SLV: Standard liver volume.
- Citation: Feng LM, Wang PQ, Yu H, Chen RT, Wang J, Sheng X, Yuan ZL, Shi PM, Xie WF, Zeng X. New formula for predicting standard liver volume in Chinese adults. World J Gastroenterol 2017; 23(27): 4968-4977
- URL: https://www.wjgnet.com/1007-9327/full/v23/i27/4968.htm
- DOI: https://dx.doi.org/10.3748/wjg.v23.i27.4968


