©The Author(s) 2017.
World J Gastroenterol. Jul 21, 2017; 23(27): 4910-4919
Published online Jul 21, 2017. doi: 10.3748/wjg.v23.i27.4910
Published online Jul 21, 2017. doi: 10.3748/wjg.v23.i27.4910
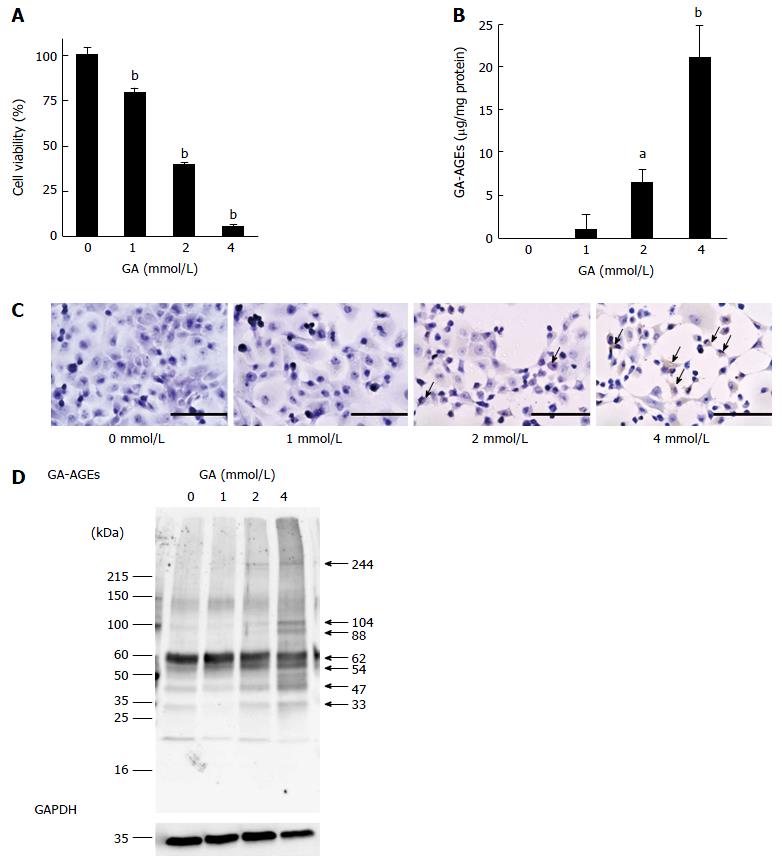
Figure 1 Analysis of cell viability, quantity of glyceraldehyde-derived advanced glycation-end products, immunostaining of glyceraldehyde-derived advanced glycation-end products, and molecular weight of glyceraldehyde-derived advanced glycation-end products in PANC-1 cells treated with glyceraldehyde for 24 h.
A: Cell viability was assessed by the WST-8 assay. This assay was performed for three independent experiments. One assay was performed for n = 7. Data are shown as mean ± SD (n = 7); B: Slot blotting analysis of intracellular glyceraldehyde (GA)-derived advanced glycation-end products (GA-AGEs). Cell lysates (2.0 μg of protein/lane) were blotted onto polyvinylidene difluoride (PVDF) membranes. The amount of GA-AGEs was calculated based on a standard curve for GA-AGEs-BSA. Slot blotting was performed for three independent experiments. Data are shown as mean ± SD (n = 3); C: Immunostaining of GA-AGEs in PANC-1 cells. Cells were treated with 0, 1, 2 and 4 mmol/L GA. The arrow indicates the area stained by the anti-GA-AGE antibody. The scale bar represents 200 μm; D: Western blotting analysis of intracellular GA-AGEs in PANC-1 cells. Cell lysates (15 μg of proteins/lane) were loaded on a 40-150 g/L polyacrylamide gradient gel. Proteins on the PVDF membrane were probed with anti-GA-AGE and anti-GA-3-phosphate dehydrogenase (GAPDH) antibodies. The molecular weight of GA-AGEs was calculated based on a single logarithmic chart used by the molecular marker. GAPDH was used as the loading control. WB was performed for two independent experiments. A and B: P values were based on Dunnett’s test. aP < 0.05, bP < 0.01 vs control.
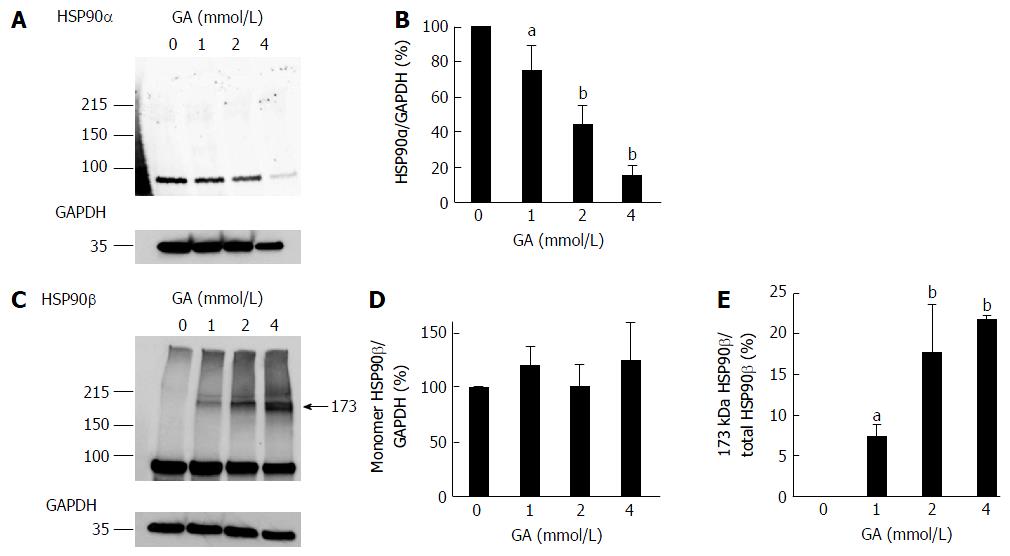
Figure 2 Western blotting analysis of HSP90α and HSP90β.
PANC-1 cell lysates (15 μg of proteins/lane) were loaded on a 40-150 g/L polyacrylamide gradient gel. A: Proteins on the polyvinylidene difluoride (PVDF) membrane were probed with anti-HSP90α and anti-GAPDH antibodies; B: Expression levels of HSP90α were normalized with GAPDH; C: Proteins on the PVDF membrane were probed with anti-HSP90β and anti-GAPDH antibodies. A band of 173 kDa HSP90β only appeared in PANC-1 cells treated with GA; D: Expression levels of the monomer HSP90β were normalized with GAPDH; E: The 173 kDa HSP90β/total HSP90β ratio. A and C: Western blotting was performed for three independent experiments. GAPDH was used as the loading control; B, D and E: Data are shown as mean ± SD (n = 3). P values were based on Dunnett’s test. aP < 0.05, bP < 0.01 vs control. GA: Glyceraldehyde.
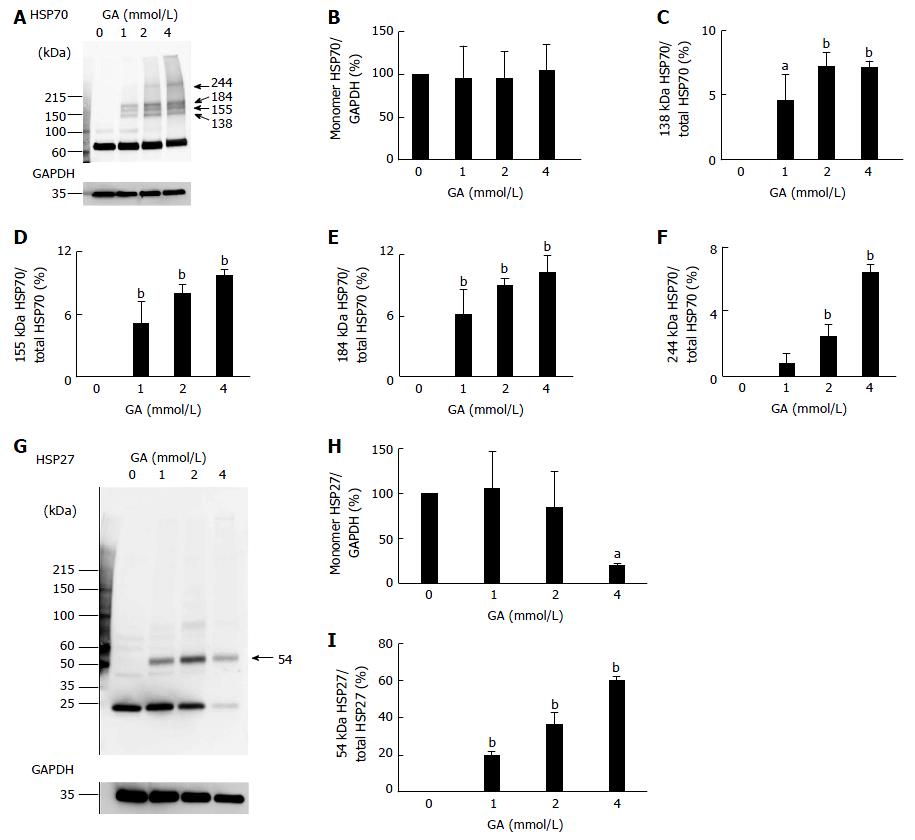
Figure 3 Western blotting analysis of HSP70 and HSP27.
PANC-1 cell lysates (15 μg of proteins/lane) were loaded on a 40-150 g/L polyacrylamide gradient gel. A: Proteins on the polyvinylidene difluoride (PVDF) membrane were probed with anti-HSP70 and anti-GA-3 phosphate dehydrogenase (anti-GAPDH) antibodies. We found four high-molecular-weight (HMW) complexes of HSP70s only in PANC-1 cells treated with GA. Their MWs were 138, 155, 184 and 244 kDa; B: Expression levels of the monomer HSP70 were normalized with GAPDH; C-F: The 138 kDa HSP70/total HSP70, 155 kDa HSP70/total HSP70, 184 kDa HSP70/total HSP70, and 244 kDa HSP70/total HSP70 ratios; G: Proteins on the PVDF membrane were probed with anti-HSP27 and anti-GAPDH antibodies. A HMW complex with a MW of 54 kDa appeared only in PANC-1 cells treated with GA; H: Expression levels of the monomer HSP27 were normalized with GAPDH; I: The 54 kDa HSP27/total HSP27 ratio; A and G: WB was performed for three independent experiments. GAPDH was used as a loading control. B-F, H, I: Data are shown as mean ± SD (n = 3). P values were based on Dunnett’s test. aP < 0.05, bP < 0.01 vs control. GA: Glyceraldehyde.
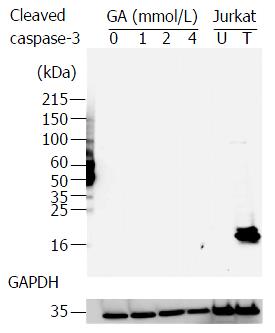
Figure 4 Western blotting analysis of cleaved caspase-3.
PANC-1 cell lysates (15 μg of protein/lane) and Jurkat cell lysates (10 μg of protein/lane) were loaded on a 40-150 g/L polyacrylamide gradient gel. Proteins on the PVDF membrane were probed with anti-cleaved caspase-3 and anti-GA-3 phosphate dehydrogenase (anti-GAPDH) antibodies. U: The lysate of Jurkat cells not treated with cytochrome c. T: The lysate of Jurkat cells treated with cytochrome c. Western blotting was performed for three independent experiments. GAPDH was used as a loading control. GA: Glyceraldehyde.
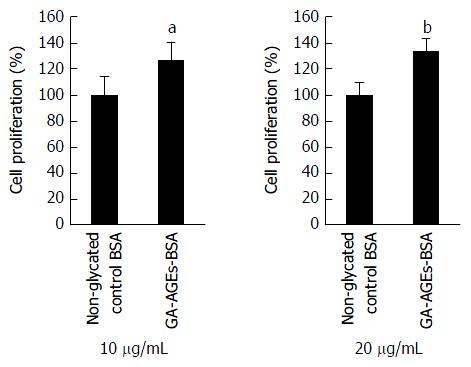
Figure 5 Analysis of the proliferation of PANC-1 cells treated with glyceraldehyde-derived advanced glycation-end products-bovine serum albumin.
PANC-1 cells were treated with 10 and 20 μg/mL of non-glycated control BSA and glyceraldehyde-derived advanced glycation-end products-bovine serum albumin (GA-AGEs-BSA) to then be incubated for 24 h. This assay was performed for two independent experiments. One assay was performed for n = 7. Cell proliferation was assessed by the WST-8 assay. Data are shown as mean ± SD (n = 7). P values were based on the Student’s t-test. aP < 0.05, bP < 0.01 vs control.
- Citation: Takata T, Ueda T, Sakasai-Sakai A, Takeuchi M. Generation of glyceraldehyde-derived advanced glycation end-products in pancreatic cancer cells and the potential of tumor promotion. World J Gastroenterol 2017; 23(27): 4910-4919
- URL: https://www.wjgnet.com/1007-9327/full/v23/i27/4910.htm
- DOI: https://dx.doi.org/10.3748/wjg.v23.i27.4910


