Copyright
©The Author(s) 2017.
World J Gastroenterol. Jan 7, 2017; 23(1): 76-86
Published online Jan 7, 2017. doi: 10.3748/wjg.v23.i1.76
Published online Jan 7, 2017. doi: 10.3748/wjg.v23.i1.76
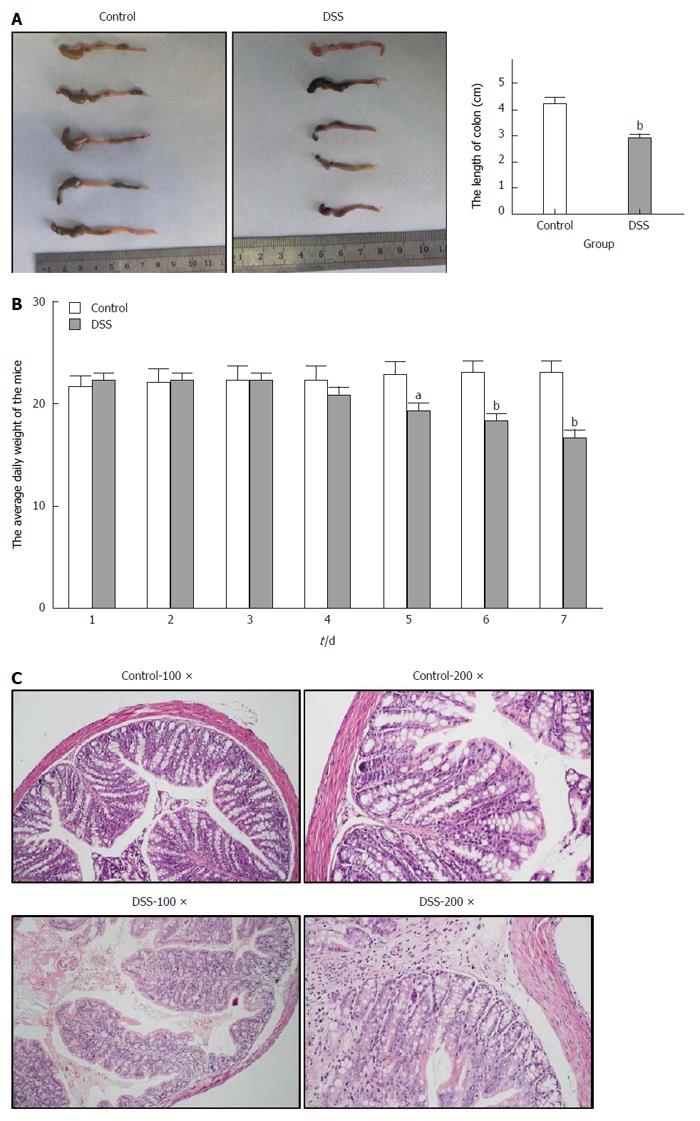
Figure 1 Successful establishment of an inflammatory bowel disease mouse model.
A: The overall colon length was significantly shortened in the dextran sulfate sodium (DSS) group; B: The average weight of the mice began to decrease significantly from Day 4 in the DSS group; C: Haematoxylin and eosin staining showed damage to the colon glands, mucosal ulceration and inflammatory cell infiltration in the DSS group; different magnifications are shown. aP < 0.05; bP < 0.01.
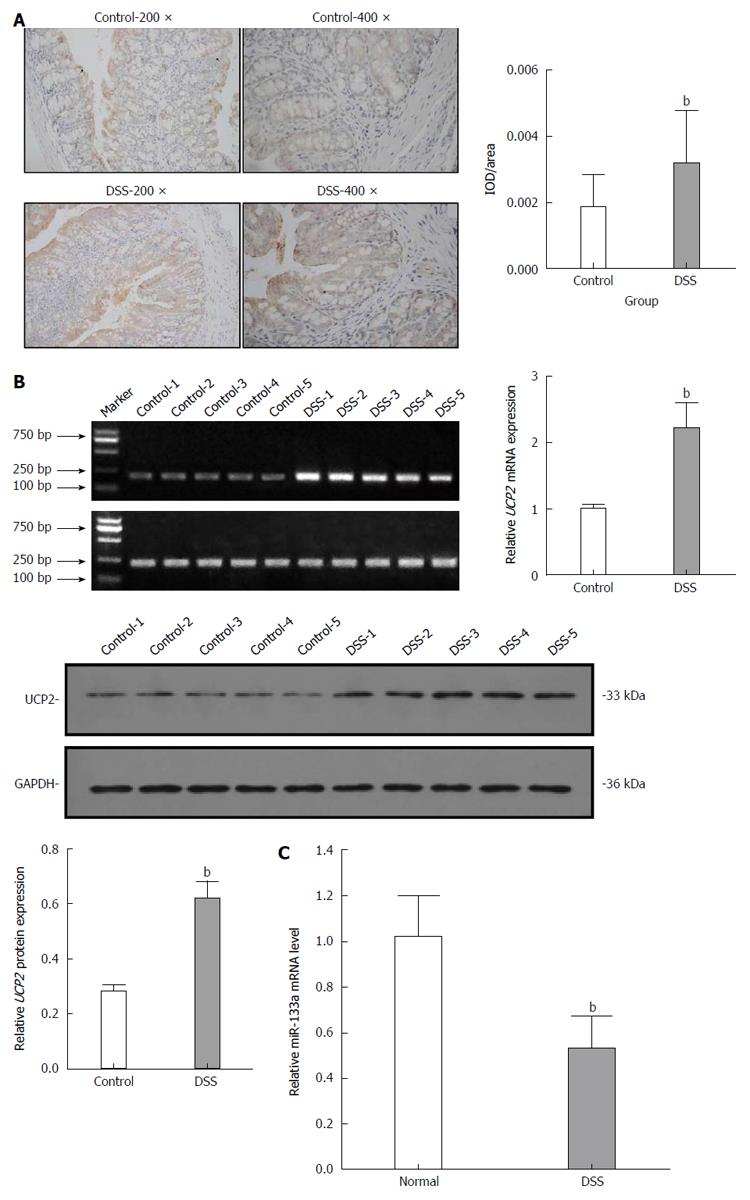
Figure 2 Significantly increased UCP2 and decreased miR-133a levels in the dextran sulfate sodium group.
A: Immunohistochemical staining (upper panel) and Western blot (lower panel) showed increased UCP2 expression in the cytoplasm of colons from mice in the dextran sulfate sodium (DSS) group; B: qRT-PCR showed significantly increased UCP2 mRNA in the DSS group; C: qRT-PCR showed significantly decreased miR-133a mRNA in the DSS group. bP < 0.01.
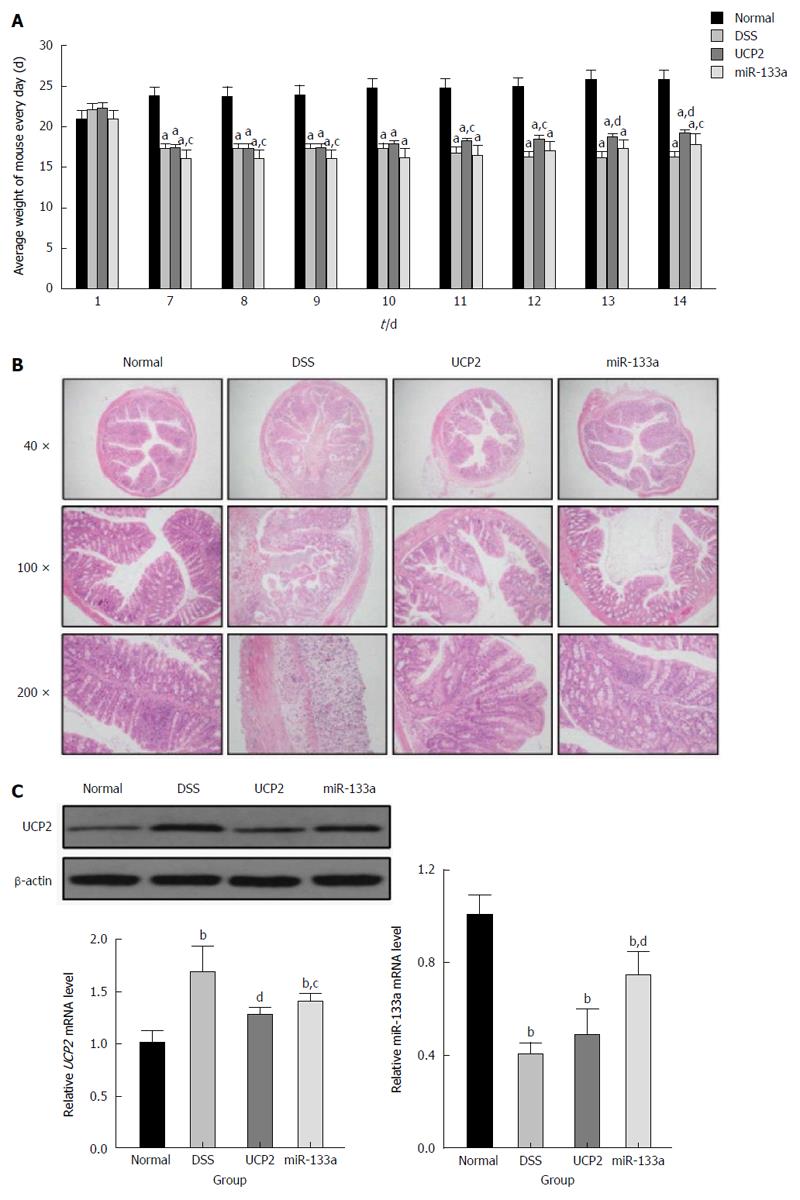
Figure 3 Inflammatory bowel disease phenotype change after the successful alteration of the UCP2 and miR-133a levels.
A: Changes in the weight of mice in the control, dextran sulfate sodium (DSS), UCP2 and miR-133a groups between days 7 and 14; B: Alleviation of IBD after the alteration of the UCP2 and miR-133a levels, as demonstrated by HE staining; C: Successful UCP2 down regulation and miR-133a up regulation in the UCP2 and miR-133a groups, as shown by Western blot and qRT-PCR, respectively. aP < 0.05, bP < 0.01 vs control; cP < 0.05, dP < 0.01 vs DSS.
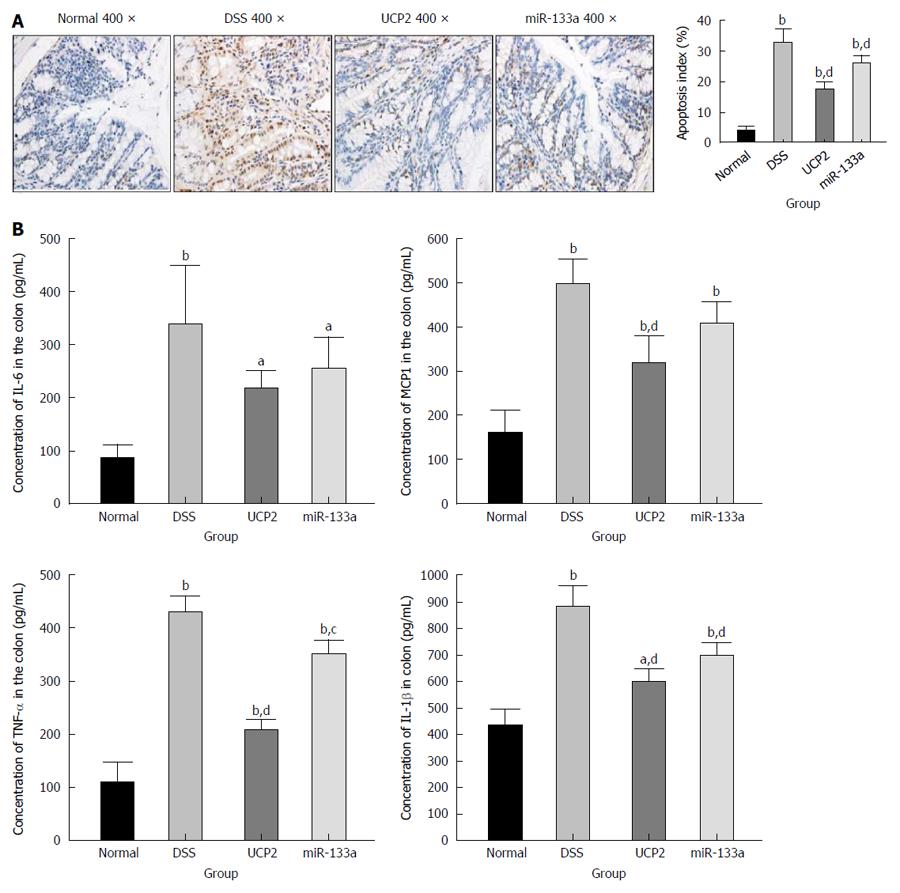
Figure 4 Changes in markers of apoptosis and inflammation in the dextran sulfate sodium, UCP2 and miR-133a groups.
A: Changes in apoptosis in the different groups, as shown by dTUNEL staining (brown colour in the cell indicates apoptosis); B: Changes in the levels of IL-6, MCP1, TNF-α and IL-1β in the different groups. aP < 0.05, bP < 0.01 vs control; cP < 0.05, dP < 0.01 vs DSS. DSS: Dextran sulfate sodium.
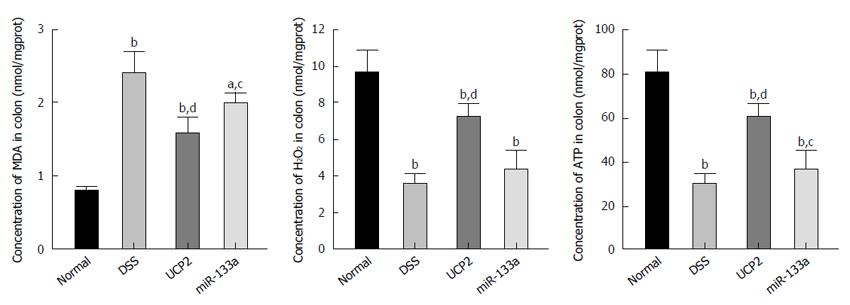
Figure 5 Changes in oxidative stress- and energy-related markers in the dextran sulfate sodium, UCP2 and miR-133a groups.
The levels of MDA (left panel), H2O2 (middle panel) and ATP (right panel) were tested by a colorimetric method. aP < 0.05, bP < 0.01 vs control; cP < 0.05, dP < 0.01 vs DSS. DSS: Dextran sulfate sodium.
- Citation: Jin X, Chen D, Zheng RH, Zhang H, Chen YP, Xiang Z. miRNA-133a-UCP2 pathway regulates inflammatory bowel disease progress by influencing inflammation, oxidative stress and energy metabolism. World J Gastroenterol 2017; 23(1): 76-86
- URL: https://www.wjgnet.com/1007-9327/full/v23/i1/76.htm
- DOI: https://dx.doi.org/10.3748/wjg.v23.i1.76


