Copyright
©The Author(s) 2016.
World J Gastroenterol. Jan 21, 2016; 22(3): 1289-1296
Published online Jan 21, 2016. doi: 10.3748/wjg.v22.i3.1289
Published online Jan 21, 2016. doi: 10.3748/wjg.v22.i3.1289
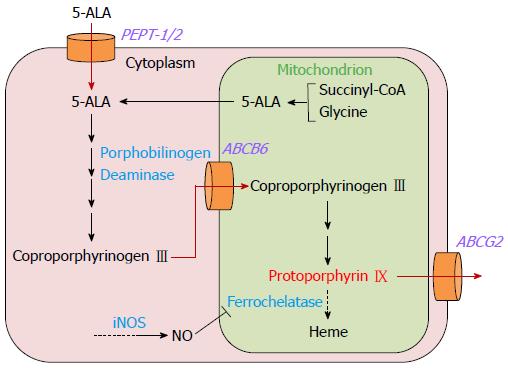
Figure 1 Metabolic pathway of 5-aminolevulinic acid and mechanism of intracellular protoporphyrin IX accumulation in gastric cancer cells.
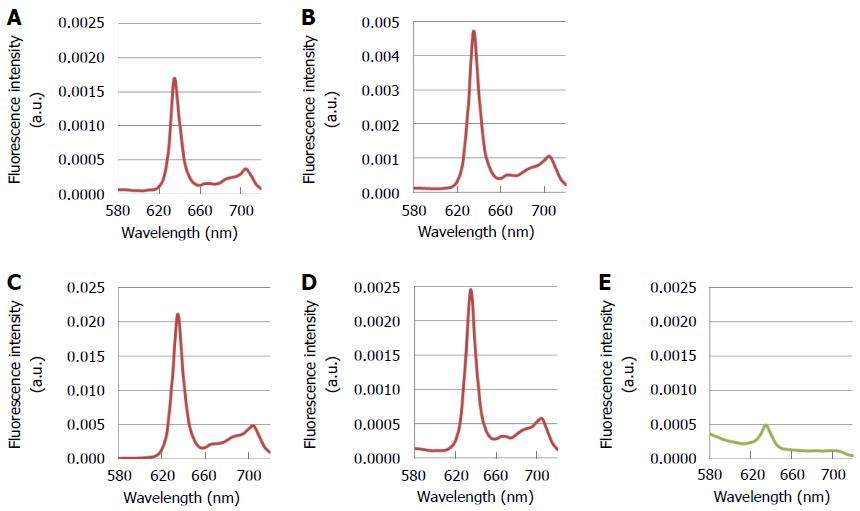
Figure 2 Fluorescence spectra of various kinds of gastric cancer cell lines after treatment with 5-aminolevulinic acid and excitation with 405-nm light.
A: MKN-7, derived from a well differentiated gastric cancer; B: MKN-74, derived from a moderately differentiated gastric cancer; C: MKN-45, derived from a poorly differentiated gastric cancer; D: Kato-III, derived from a signet-ring cell carcinoma; E: NIH-3T3, a non-cancerous fibroblast-like cell line. Each cell line was incubated with 1 mmol/L 5-ALA for 30 min. The conditions of spectral acquisition were equivalent among all samples. Spectra were measured with the MCPD-7000 spectral analytical system (Otsuka Electronics, Co., Ltd., Osaka, Japan).
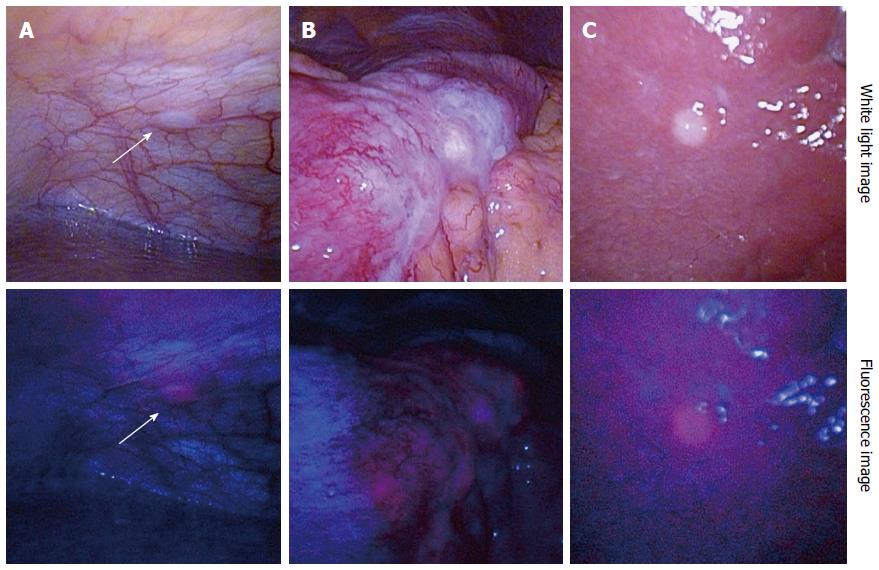
Figure 3 Representative images of 5-aminolevulinic acid - photodynamic diagnosis.
Upper column: White light images; Lower column: Fluorescence images. A: Peritoneal dissemination (arrows); B: Serosal invasion of primary gastric cancer; C: Superficial liver metastasis. Excitation: 405-nm; Emission: > 450-nm.
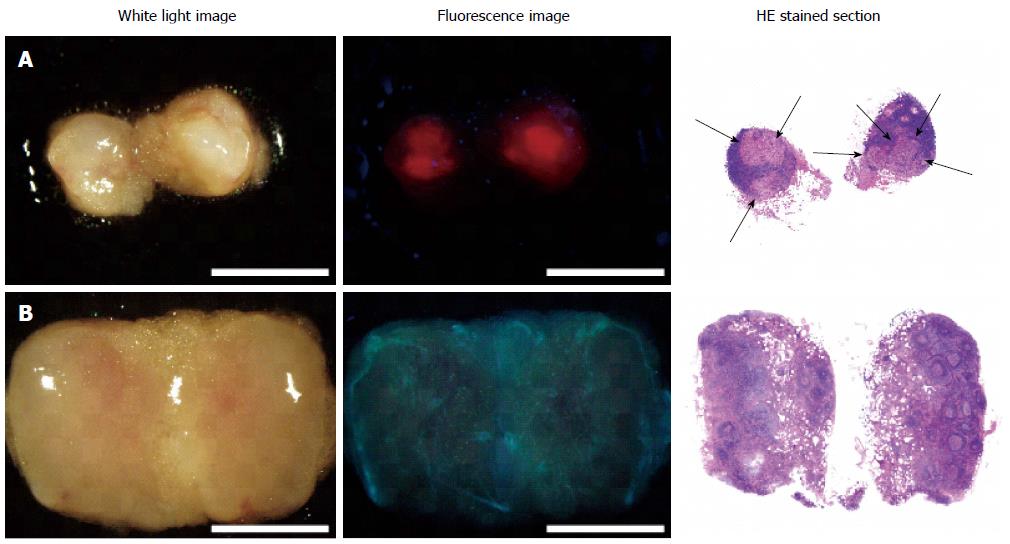
Figure 4 5-aminolevulinic acid - photodynamic diagnostic imaging of metastatic and non-metastatic lymph nodes[17].
Left column: White-light images; Middle column: Fluorescence images; Right column: Hematoxylin-eosin stained sections. A: Metastatic lymph node; B: Non-metastatic lymph node. Arrows indicate metastatic foci. In the metastatic lymph node, red fluorescence aligns with the metastatic foci. White light and fluorescence images were acquired with the SZX-12 stereomicroscope (Olympus, Tokyo, Japan) equipped with the DP71 color charge-coupled digital camera (Olympus). Excitation: 395-nm to 415-nm; Emission: > 430-nm; Scale bars: 3-mm.
- Citation: Koizumi N, Harada Y, Minamikawa T, Tanaka H, Otsuji E, Takamatsu T. Recent advances in photodynamic diagnosis of gastric cancer using 5-aminolevulinic acid. World J Gastroenterol 2016; 22(3): 1289-1296
- URL: https://www.wjgnet.com/1007-9327/full/v22/i3/1289.htm
- DOI: https://dx.doi.org/10.3748/wjg.v22.i3.1289


