Copyright
©The Author(s) 2016.
World J Gastroenterol. Jul 7, 2016; 22(25): 5769-5779
Published online Jul 7, 2016. doi: 10.3748/wjg.v22.i25.5769
Published online Jul 7, 2016. doi: 10.3748/wjg.v22.i25.5769
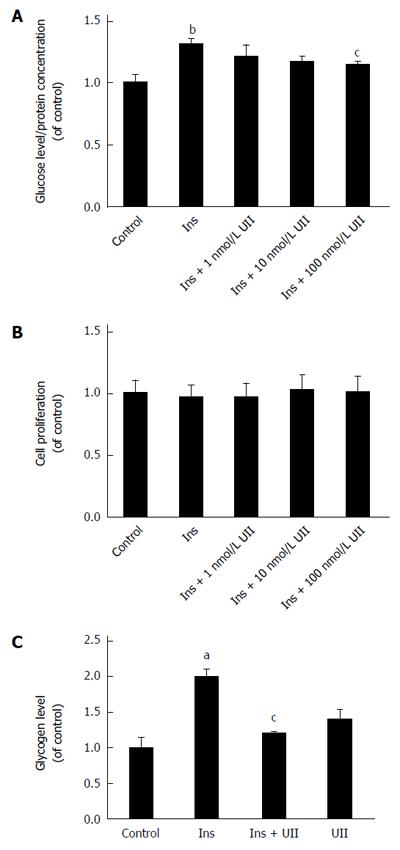
Figure 1 Urotensin II decreases glucose consumption and glycogen synthesis in HepG2 hepatocytes.
HepG2 cells were cultured in the presence of 0, 1, 10, or 100 nmol/L urotensin II (UII) for 24 h prior to stimulation with insulin (100 nmol/L, 30 min). Glucose consumption decreased in a dose-dependent manner (A). There was no cytotoxic effect of UII after incubation for 24 h (B). Exposure of HepG2 cells to UII (100 nmol/L, 24 h) reduced the intracellular glycogen content (C). Data from at least three independent experiments are presented as mean ± SD. aP < 0.05, bP < 0.01 vs control group; cP < 0.05 vs insulin (Ins) treatment alone.
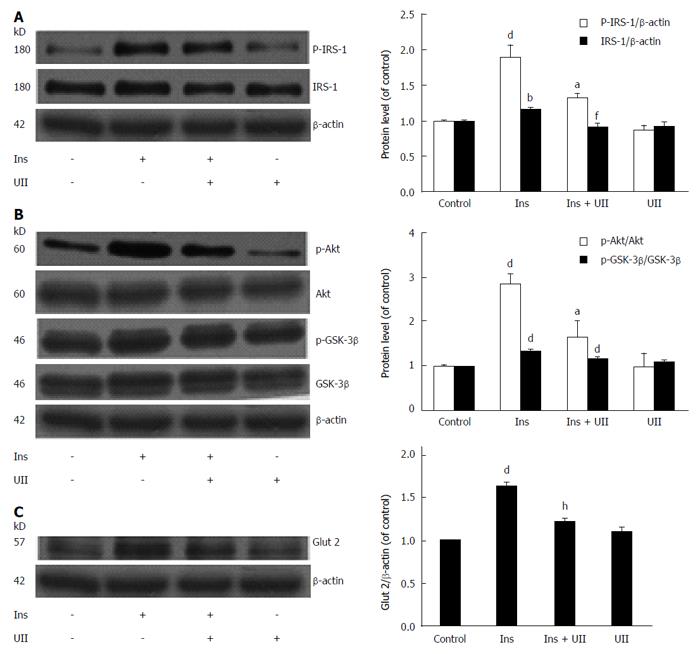
Figure 2 Urotensin II inhibits insulin receptor-mediated signal transduction in HepG2 cells.
HepG2 cells were exposed to 100 nmol/L urotensin II (UII) for 24 h prior to stimulation with insulin (100 nmol/L, 30 min), and total cell lysates were then subjected to Western blot analysis. UII impaired IRS-1 and Glut 2 protein levels and reduced phosphorylation of IRS-1, Akt, and GSK-3β (A-C). Data from at least three independent experiments are presented as the mean ± SD. bP < 0.01, dP < 0.001 vs control group; aP < 0.05, fP < 0.01, hP < 0.001 vs insulin treatment alone.
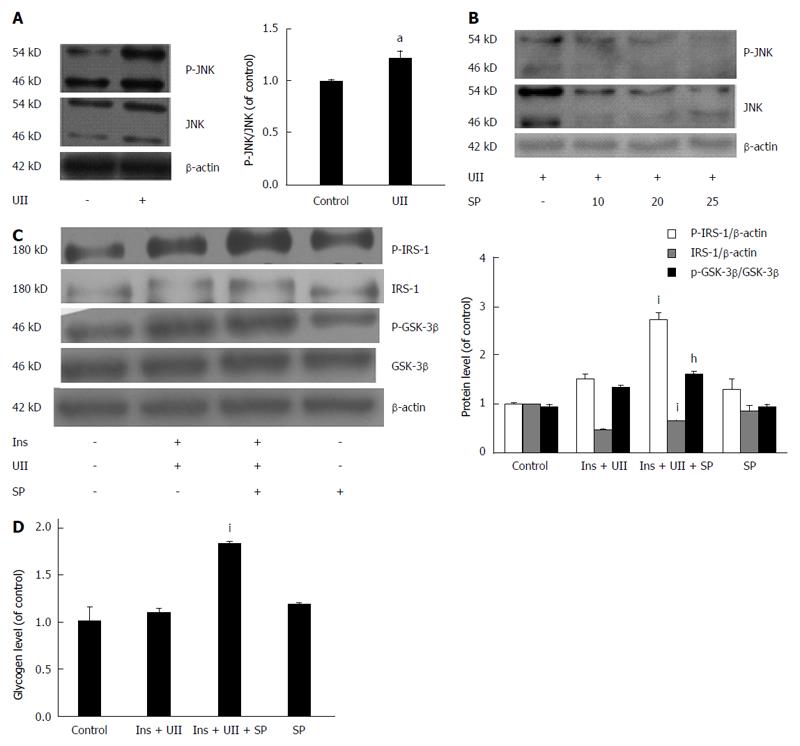
Figure 3 Activation of JNK by urotensin II contributes to urotensin II-induced insulin resistance.
HepG2 cells were incubated with 100 nmol/L urotensin II (UII) for 24 h and were pretreated with the JNK inhibitor SP600125 for 30 min. Total cell lysates were analyzed by Western blot analysis. UII increased JNK phosphorylation (A), and this effect was dose-dependently abolished by SP600125 (B). The effects of UII on IRS-1 protein and glycogen content and phosphorylation of IRS-1 and GSK-3β were all rescued by SP600125 (C, D). Data from at least three independent experiments are presented as the mean ± SD. aP < 0.05 vs control group; hP < 0.05, iP < 0.001 vs insulin + UII group.
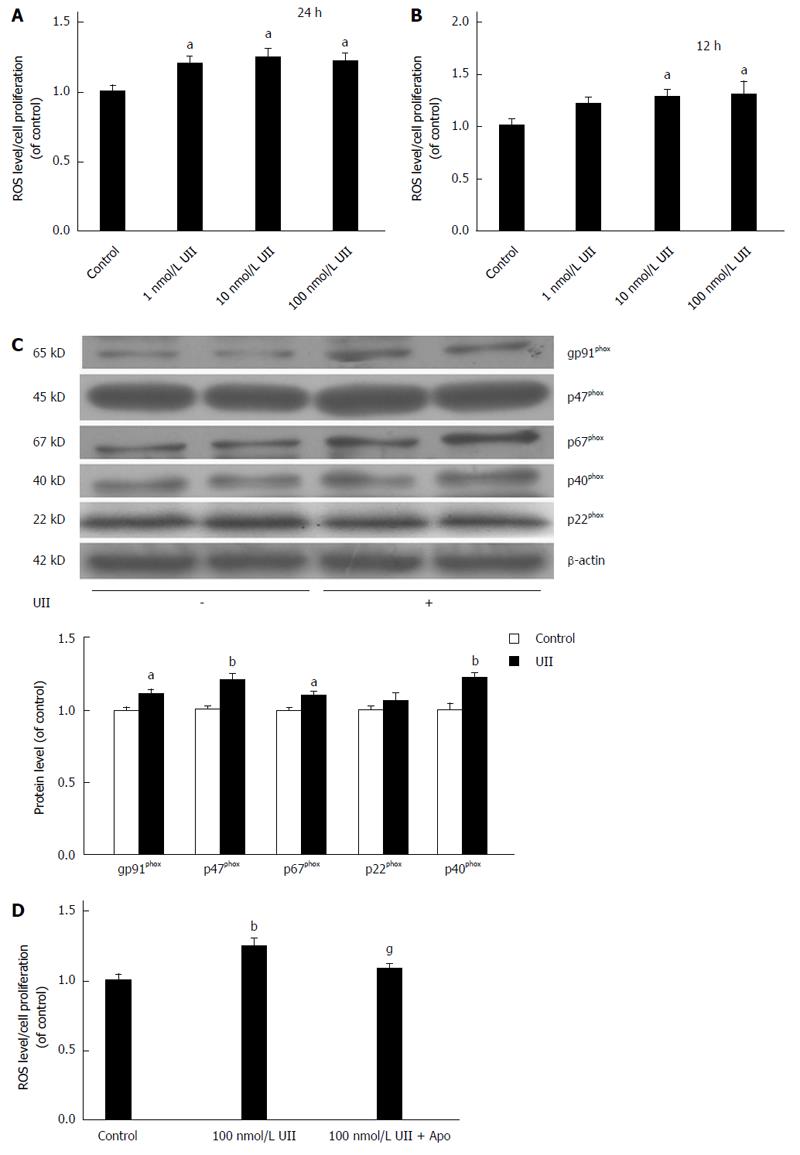
Figure 4 Urotensin II elevates reactive oxygen species production and NADPH oxidase subunit expression.
HepG2 cells were cultured with 0, 1, 10, or 100 nmol/L urotensin II (UII) for 24 h, with or without prior stimulation with apocynin (200 μmol/L, 30 min). Intracellular reactive oxygen species (ROS) production was elevated in a dose- and time-dependent manner (A, B). NADPH oxidase subunits gp91phox, p67phox, p47phox, and p40phox were significantly increased in response to UII (100 nmol/L, 24 h) (C). Apocynin pretreatment inhibited ROS generation (D). Data from at least three independent experiments are presented as the mean ± SD. aP < 0.05, bP < 0.01 vs control group; gP < 0.05 vs UII treatment alone.
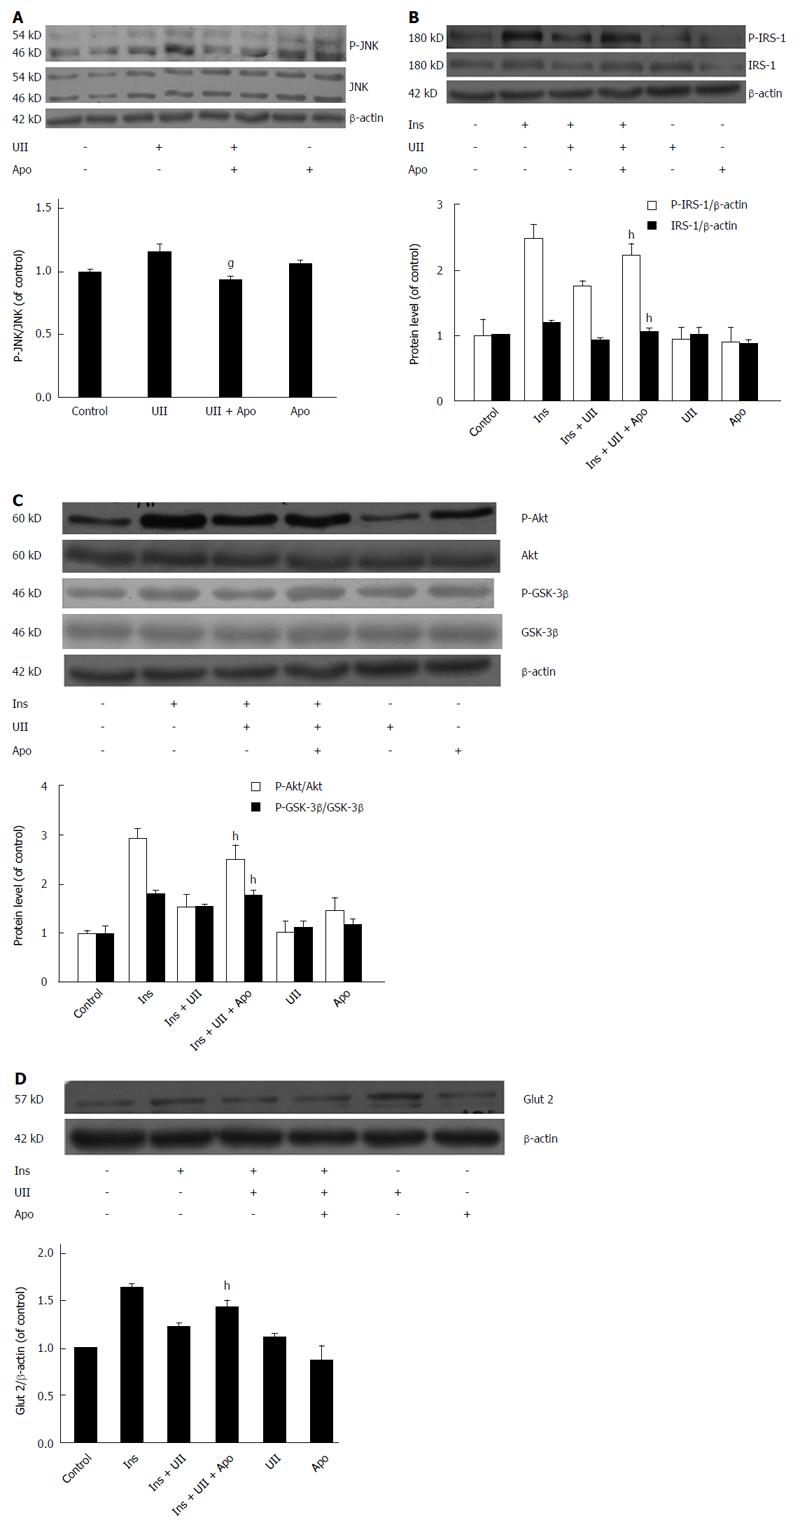
Figure 5 Urotensin II interferes with insulin signaling, and this effect is reversed by apocynin.
HepG2 cells were exposed to 100 nmol/L urotensin II (UII) for 24 h prior to stimulation with insulin (100 nmol/L, 30 min), and pretreatment with 200 μmol/L apocynin for 30 min. Total cell lysates were analyzed by Western blot. UII increased JNK phosphorylation, and this effect was abolished by apocynin (A); Protein levels of IRS-1 and Glut 2 and phosphorylation of IRS-1, Akt and GSK-3β were all reversed by apocynin (B-D). Data from at least three independent experiments are presented as the mean ± SD. gP < 0.05 vs UII treatment alone; hP < 0.05 vs insulin + UII group.
- Citation: Li YY, Shi ZM, Yu XY, Feng P, Wang XJ. Urotensin II-induced insulin resistance is mediated by NADPH oxidase-derived reactive oxygen species in HepG2 cells. World J Gastroenterol 2016; 22(25): 5769-5779
- URL: https://www.wjgnet.com/1007-9327/full/v22/i25/5769.htm
- DOI: https://dx.doi.org/10.3748/wjg.v22.i25.5769


