©The Author(s) 2016.
World J Gastroenterol. May 21, 2016; 22(19): 4685-4694
Published online May 21, 2016. doi: 10.3748/wjg.v22.i19.4685
Published online May 21, 2016. doi: 10.3748/wjg.v22.i19.4685
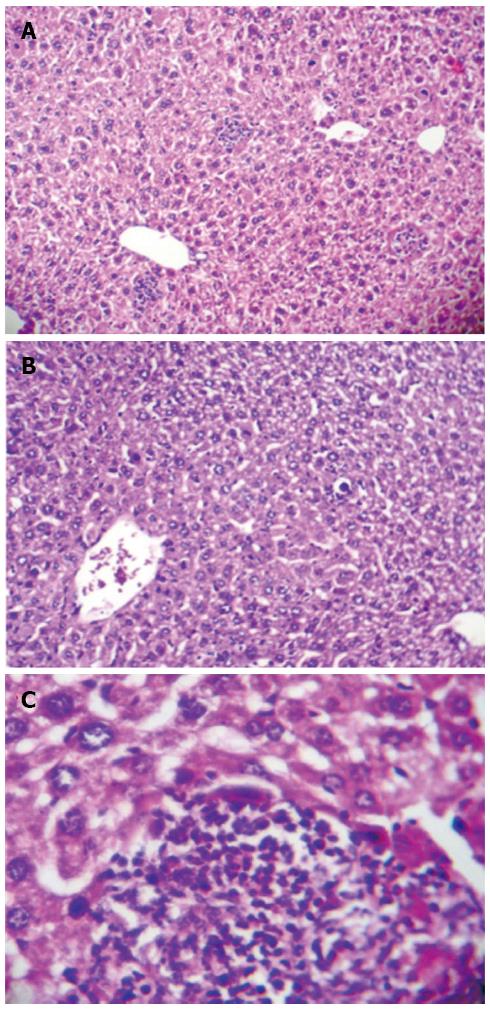
Figure 1 Histological change in liver tissue of CCl4-induced cirrhotic rats (hematoxylin and eosin; magnification × 100 and × 400).
A: Focal hepatocellular necrosis, apoptotic cells, and patchy inflammatory cell infiltration along with central vein dilation are observed; B: Fatty degeneration areas are clearly seen; C: Inflammatory cell infiltration into the portal tract.
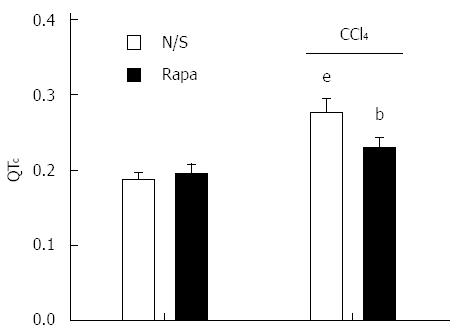
Figure 2 QT interval in control and CCl4-induced cirrhotic rats treated with normal saline or rapamycin (2 mg/kg).
QT intervals were defined as corrected QT (QTc) using Bazett’s formula. The data are expressed as the mean ± SD. eP < 0.001 vs control/normal saline group; bP < 0.01 vs control/rapamycin and cirrhotic/saline group.
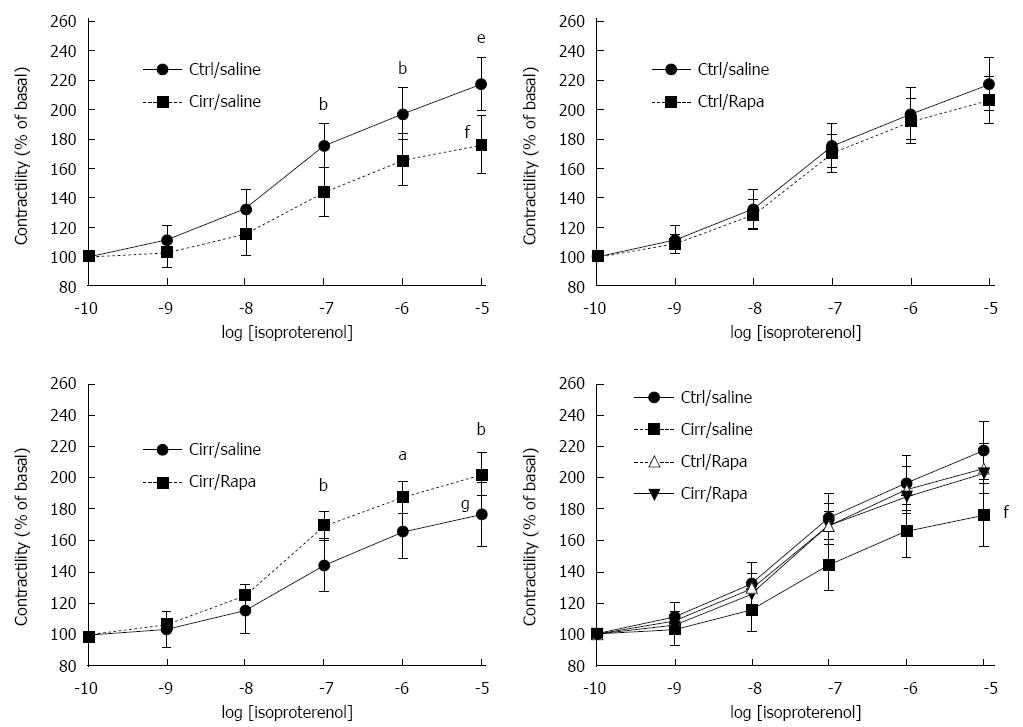
Figure 3 Contractile force in response to β-adrenergic stimulation in cirrhotic and control rats treated with normal saline or rapamycin (2 mg/kg).
Inotropic responsiveness to β-adrenergic stimulation with isoproterenol in the isolated papillary muscle from cirrhotic and control rats treated with normal saline or rapamycin (2 mg/kg) was analyzed to determine the contractile force (% of basal). The data are expressed as the mean ± SD. Maximal response (Rmax) in the CCl4-induced cirrhotic rats was significantly lower than the other groups. There were no significant differences in EC50 values among the four studied groups. fP < 0.001 vs the control group receiving normal saline; gP < 0.001 vs the cirrhosis group receiving normal saline; aP < 0.05, bP < 0.01, eP < 0.001 vs the cirrhotic group receiving normal saline in that concentration.
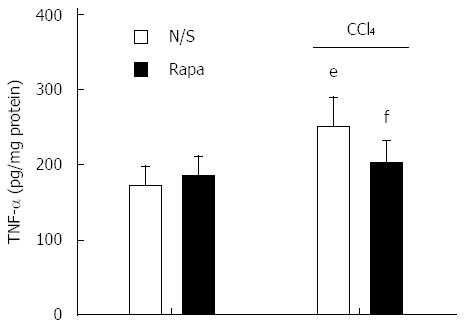
Figure 4 Left ventricular tumor necrosis factor-α levels in control and CCl4-induced cirrhotic rats treated with normal saline or rapamycin (2 mg/kg).
The data are expressed as the mean ± SD. eP < 0.001 vs control/normal saline group; fP < 0.001 vs cirrhosis/normal saline group. TNF-α: Tumor necrosis factor-α.
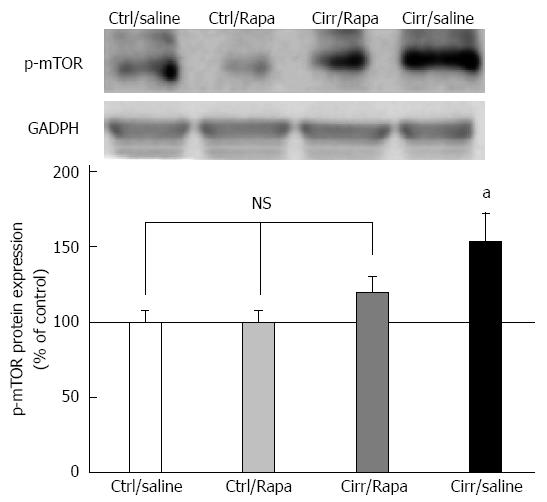
Figure 5 Western blot analysis of p-mammalian target of rapamycin protein in the left ventricles of control and CCl4-induced cirrhotic rats treated with normal saline or rapamycin (2 mg/kg).
The upper panels demonstrate the representative immunoblots of p-mTOR and glyceraldehyde 3 phosphate dehydrogenase (GAPDH) proteins in the control, control + rapamycin, cirrhotic and cirrhotic + rapamycin. The lower panel shows the densitometric analysis after normalization with GAPDH. Values are expressed as p-mTOR/GAPDH ratio (%) and normalized to the control group receiving normal saline (mean ± SD). aP < 0.05 vs the other three groups; NS: Non-significant.
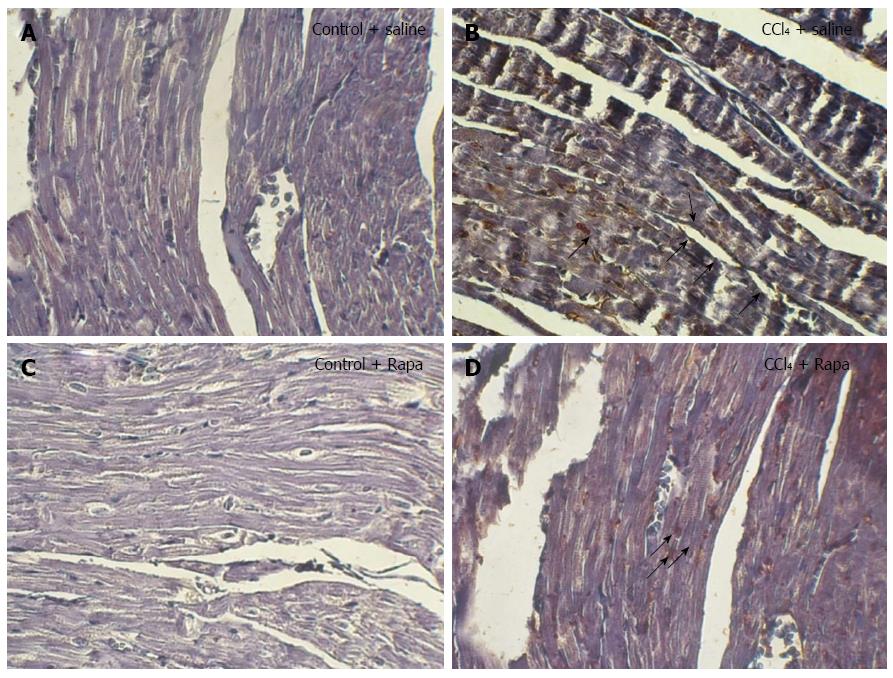
Figure 6 Immunohistochemical staining for p-mTOR in the ventricles of the rats in the following groups: control, cirrhotic, control + rapamycin and cirrhotic + rapamycin (× 400 magnification).
Human gastric tissue was used as the positive control. Note the increased immunostaining of p-mTOR in the myocytes of the rats with cirrhosis. No significant immunostaining was localized to the cardiomyocytes of the untreated cirrhotic rats. In contrast, treatment with rapamycin caused significant immunostaining in the cardiomyocytes of the cirrhotic rats. The black arrows indicate to the p-mTOR immunoblots in rat ventricles.
- Citation: Saeedi Saravi SS, Ghazi-Khansari M, Ejtemaei Mehr S, Nobakht M, Mousavi SE, Dehpour AR. Contribution of mammalian target of rapamycin in the pathophysiology of cirrhotic cardiomyopathy. World J Gastroenterol 2016; 22(19): 4685-4694
- URL: https://www.wjgnet.com/1007-9327/full/v22/i19/4685.htm
- DOI: https://dx.doi.org/10.3748/wjg.v22.i19.4685


