©The Author(s) 2016.
World J Gastroenterol. May 21, 2016; 22(19): 4673-4684
Published online May 21, 2016. doi: 10.3748/wjg.v22.i19.4673
Published online May 21, 2016. doi: 10.3748/wjg.v22.i19.4673
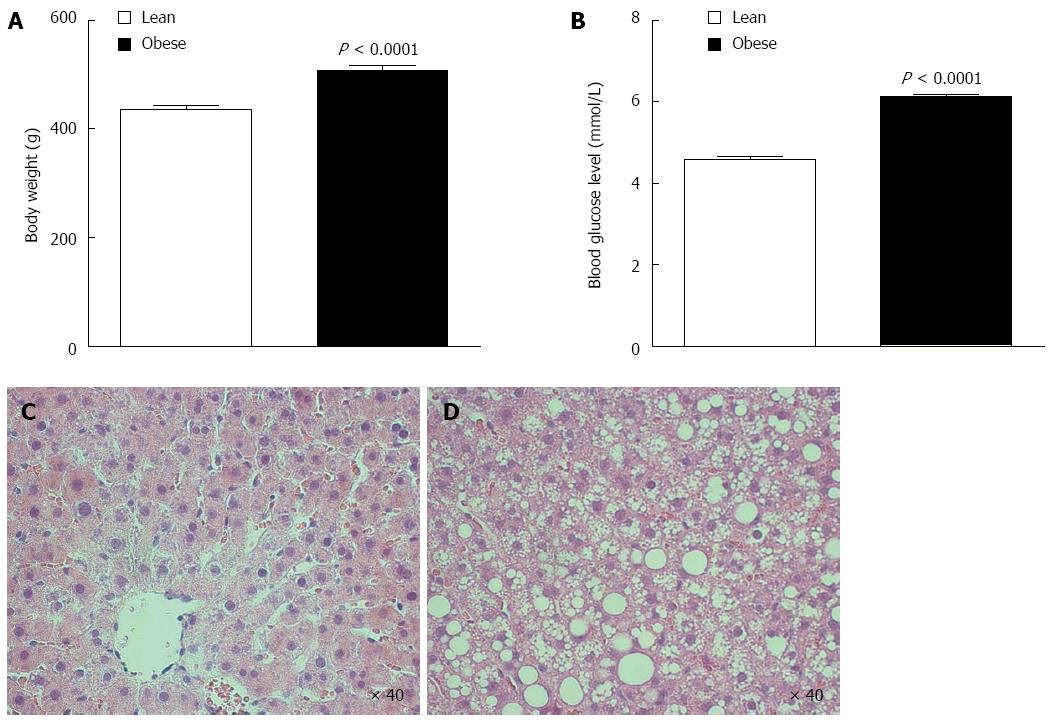
Figure 1 Bodyweight, random blood glucose, and baseline histology of high-fat/high-sucrose-fed (obese) and lean Sprague-Dawley rats.
Obese Sprague-Dawley rats were significantly heavier (A) with higher random blood glucose (B) than age-matched lean rats. Baseline liver tissue sections were stained for hemotoxylin and eosin (x 40 magnification). Representative slides are displayed, and obese rats (D) showed severe mixed hepatic steatosis while lean rat livers (C) showed mild microvesicular steatosis. Data are shown as mean ± SE (n = 30 rat/group). Statistical analyses were performed using Students t-tests for body weight and random blood glucose.
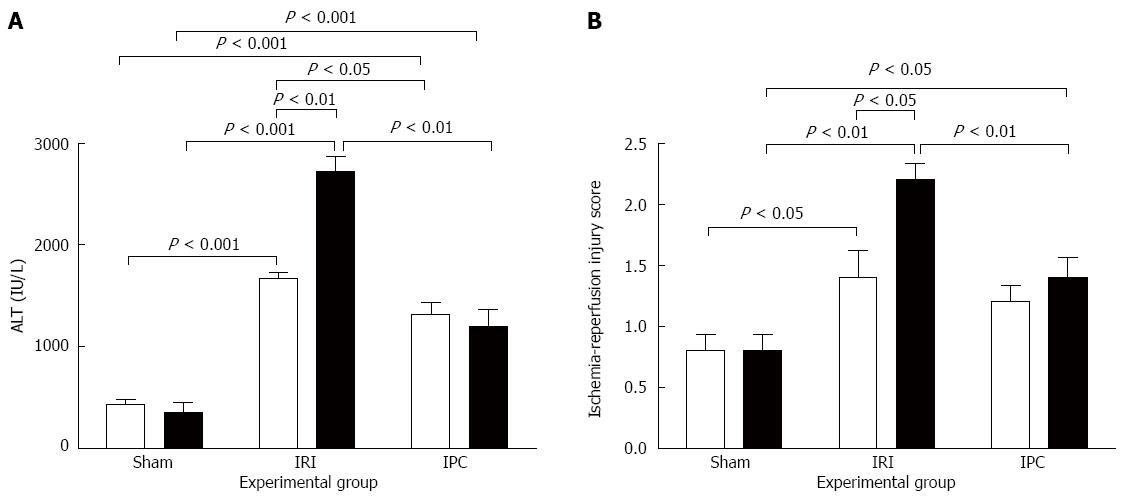
Figure 2 Serum alanine aminotransferase levels and histology injury score following ischemia-reperfusion.
Serum alanine aminotransferase (ALT) (A) and histology injury score (B) following reperfusion were significantly higher in rats subjected to IRI compared to sham rats. Both injury markers were significantly higher in obese rats compared to lean rats. Compared to corresponding IRI groups, IPC decreased ALT levels in both lean and obese rats and decreased injury score in obese rats. Data are shown as mean ± SEM (n = 10 rat/group; lean rats, open bar; obese rats, closed bar). IRI: Ischemia-reperfusion injury; IPC: Ischemic preconditioning.
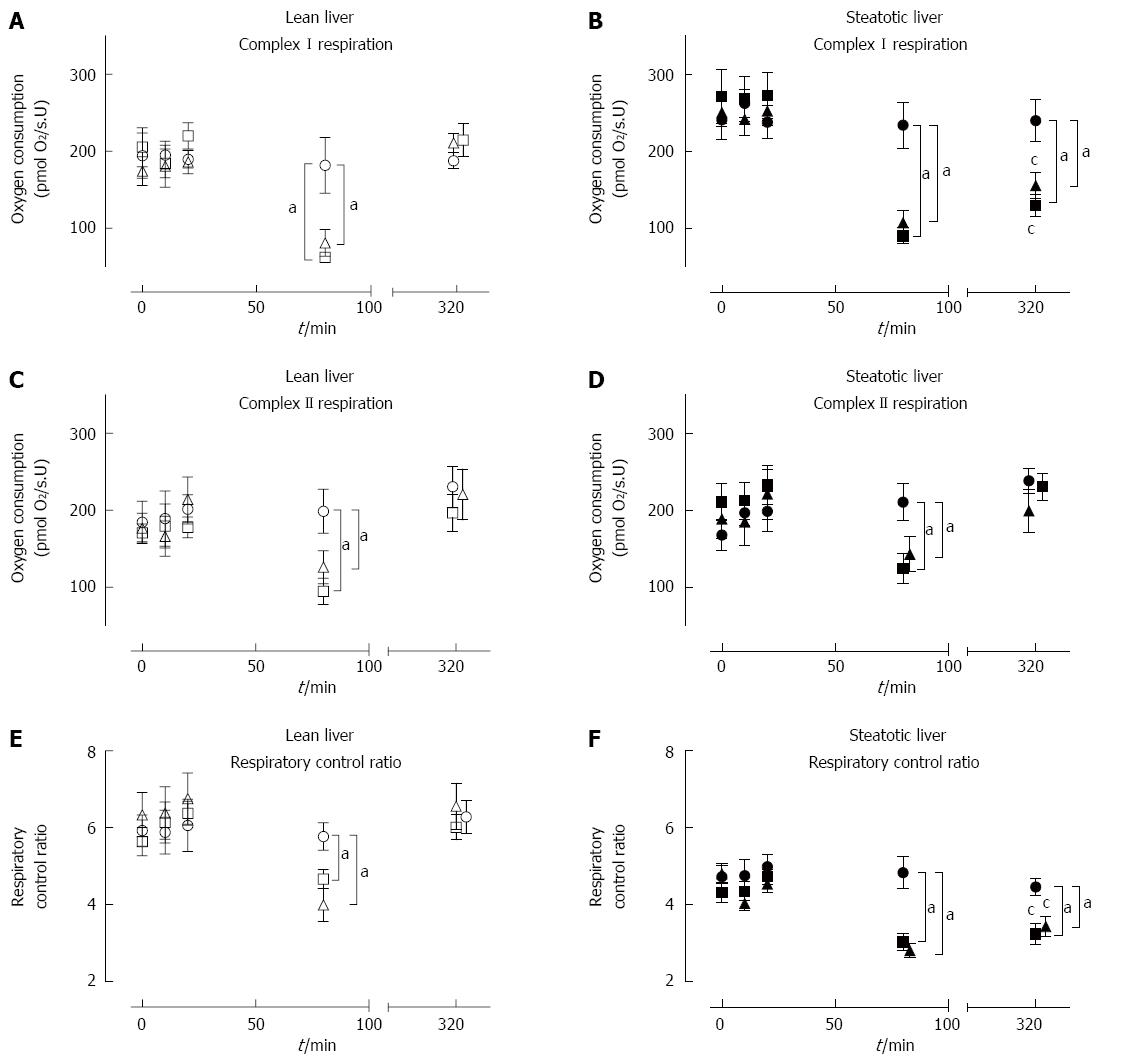
Figure 4 Mitochondrial function of lean and steatotic livers subjected to sham or ischemia-reperfusion injury with or without ischemic preconditioning.
Baseline MF was similar between lean and steatotic livers in all outcome measures. Lean-Sham and Steatotic-Sham had stable CI-OXPHOS (A, B), CII-OXPHOS (C, D), and RCR (E, F) throughout the procedure. CI-OXPHOS (A, B), CII-OXPHOS (C, D), and RCR (E, F) were significantly lower following 60 min of ischemia in Lean-IRI, Lean-IPC, Steatotic- IRI, and Steatotic-IPC livers compared to the corresponding sham group. Following reperfusion, CI-OXPHOS (B) and RCR (F) were significantly lower in Steatotic-IRI and Steatotic-IPC livers compared to Steatotic-Sham or lean livers, while CII-OXPHOS (D) returned to pre-ischemic levels comparable to Steatotic-Sham or lean livers (D). Data are shown as mean ± SE (n = 10 rat/group; Lean-Sham, open circle; Lean-IRI, open square; Lean-IPC, open triangle; Steatotic-Sham, closed circle; Steatotic-IRI, closed square; Steatotic-IPC, closed triangle). aP < 0.05 vs Lean-IRI; cP < 0.05 vs Lean-IPC (end of reperfusion). IRI: Ischemia-reperfusion injury; IPC: Ischemic preconditioning.
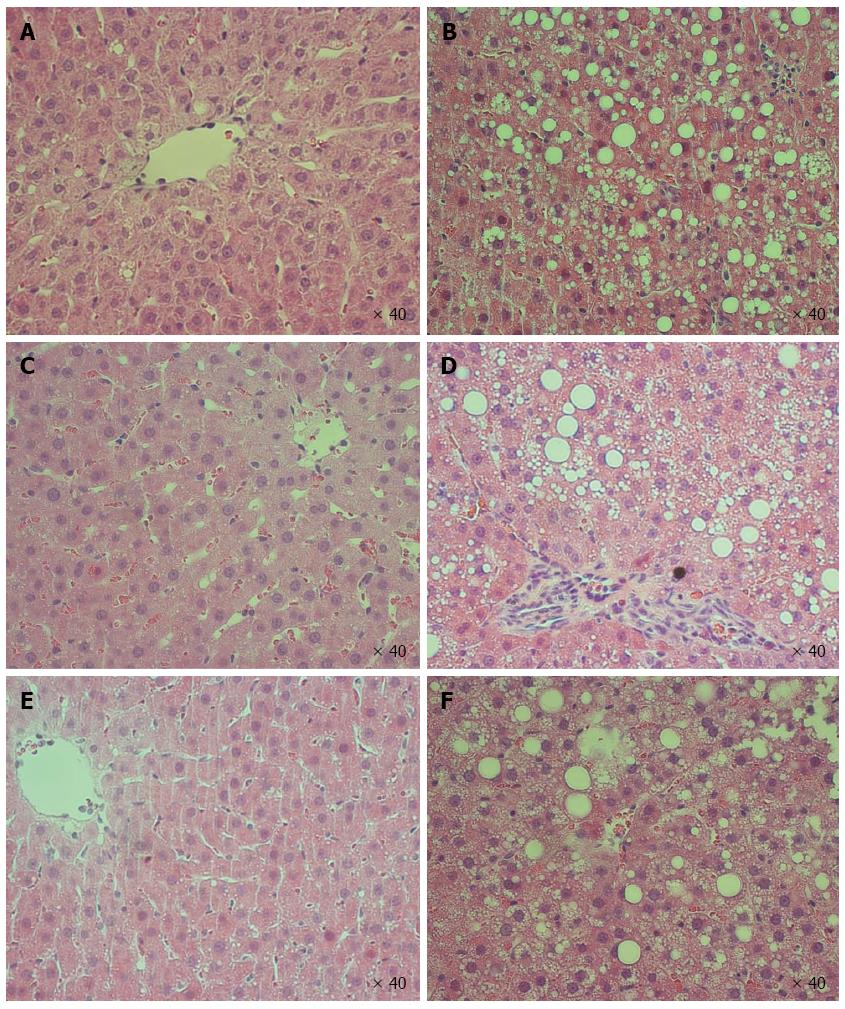
Figure 3 Liver histology following ischemia-reperfusion.
No evidence of injury was observed in Lean-Sham (A) and Steatotic-Sham (B) livers. Lean-IRI livers (C) had mild injury while Steatotic-IRI livers (D) had moderate-severe injury. Both Lean-IPC (E) and Steatotic-IPC livers (F) were observed to have mild injury following reperfusion. Representative slides are shown (n = 10 rat/group). IRI: Ischemia-reperfusion injury; IPC: Ischemic preconditioning.
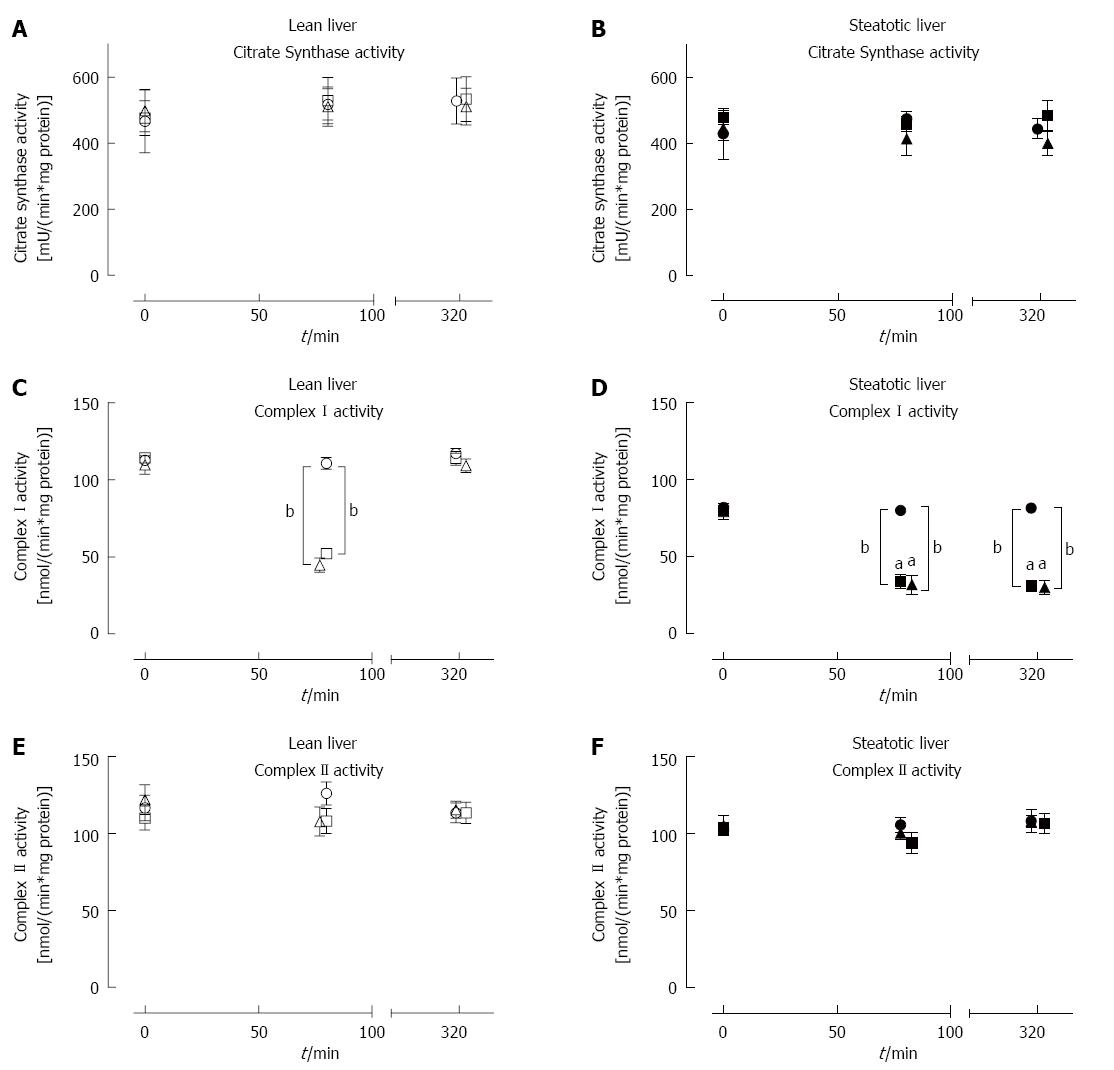
Figure 5 Citrate synthase, Complex I and Complex II activity at baseline, following ischemia and post-reperfusion in lean and steatotic livers.
CS activity was similar between lean (A) and steatotic livers (B) throughout the procedure and was not affected by IRI or IPC. Baseline CI enzyme activity in steatotic livers were lower than lean livers (C, D). After ischemia, CI enzyme activity was significantly lower in lean and steatotic livers compared to sham livers. Additionally, CI enzyme activity (D) was lower in steatotic livers post-ischemia compared to lean livers. After reperfusion, CI activity remained lower in Steatotic-IRI and Steatotic-IPC livers (D) compared to Steatotic-Sham or lean livers. CII activity (E, F) remained stable throughout the procedure and was similar between both types of livers. IPC did not have a significant effect on CI or CII activity in both types of livers. Data are expressed as mean ± SE (n = 10 rat/group; Lean-Sham, open circle; Lean-IRI, open square; Lean-IPC, open triangle; Steatotic-Sham, closed circle; Steatotic-IRI, closed square; Steatotic-IPC, closed triangle). aP < 0.05, bP < 0.001 vs time- and group-matched lean livers. CS: Citrate synthase; CI: Complex I; CII: Complex II; IRI: Ischemia-reperfusion injury; IPC: Ischemic preconditioning.
- Citation: Chu MJ, Premkumar R, Hickey AJ, Jiang Y, Delahunt B, Phillips AR, Bartlett AS. Steatotic livers are susceptible to normothermic ischemia-reperfusion injury from mitochondrial Complex-I dysfunction. World J Gastroenterol 2016; 22(19): 4673-4684
- URL: https://www.wjgnet.com/1007-9327/full/v22/i19/4673.htm
- DOI: https://dx.doi.org/10.3748/wjg.v22.i19.4673


