Copyright
©The Author(s) 2016.
World J Gastroenterol. Apr 7, 2016; 22(13): 3573-3580
Published online Apr 7, 2016. doi: 10.3748/wjg.v22.i13.3573
Published online Apr 7, 2016. doi: 10.3748/wjg.v22.i13.3573
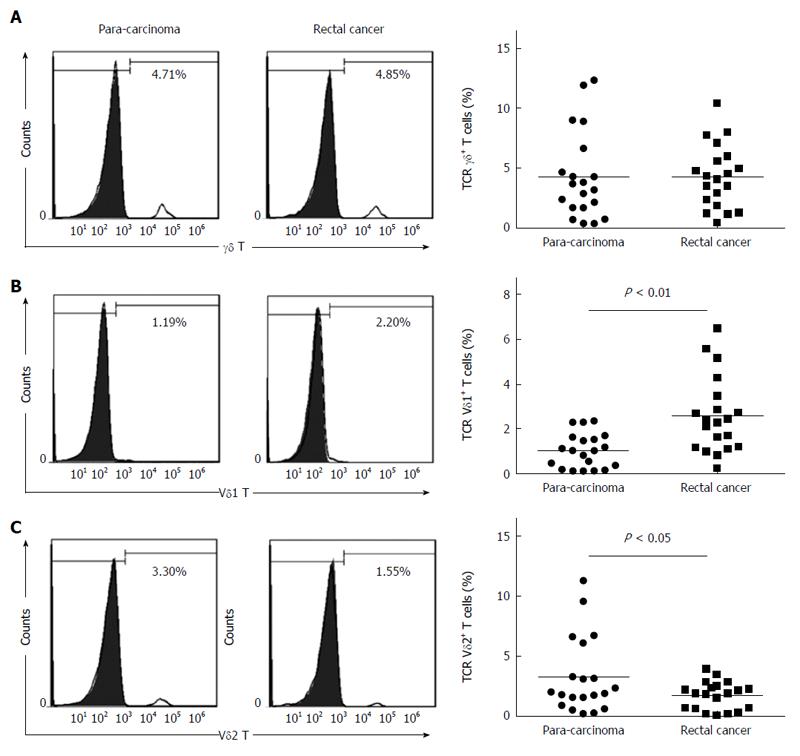
Figure 1 Percentage of infiltrating γδT cells in 20 rectal cancer patients.
Cells were stained with an anti-γδ TCR mAb, anti-Vδ1 mAb or anti-Vδ2 mAb and analyzed by flow cytometry. The left panels show representative histogram results from flow cytometry for γδ T cells (A), Vδ1 T cells (B), and Vδ2 T cells (C). The right panels show bar graphs of the percentage of positively stained cells from the patients.
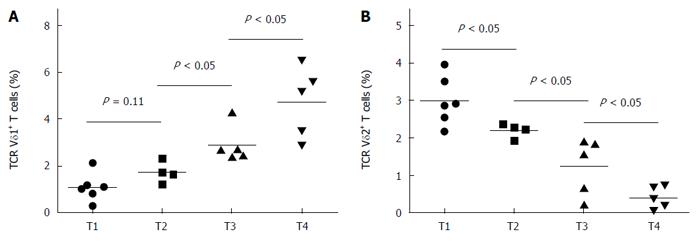
Figure 2 Percentage of tumor-infiltrating Vδ1 and Vδ2 T cells correlated with disease T stage.
A: Tumor-infiltrating Vδ1 T cells positively correlated with disease T stage; B: Tumor-infiltrating Vδ2 T cells negatively correlated with disease T stage.
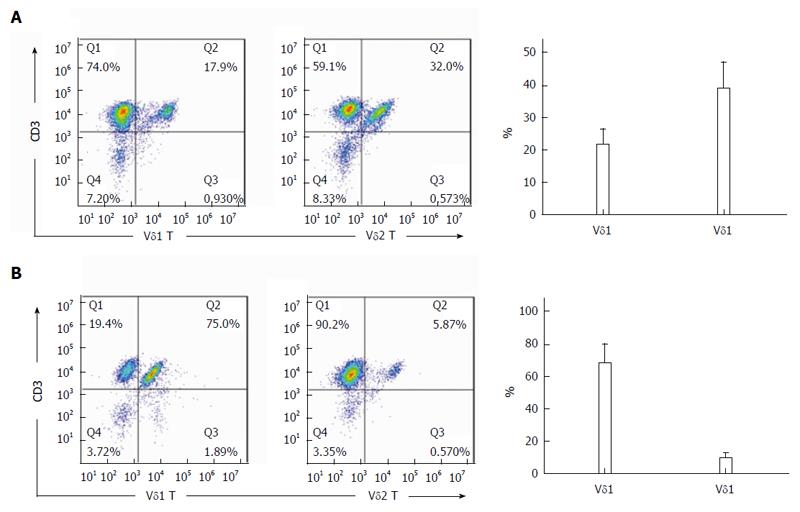
Figure 3 Percentage of Vδ1 and Vδ2 T cells from cancer tissues or para-carcinoma tissues after expansion.
Cells were stained with anti-CD3 mAb, anti-Vδ1 mAb or anti-Vδ2 mAb and analyzed by flow cytometry. The left panels show representative dot plots from flow cytometry for Vδ1 and Vδ2 T cells from para-carcinoma tissues (A) and rectal cancer tissues (B). The right panels show bar graphs of the percentage of positively stained cells from 20 rectal cancer patients.
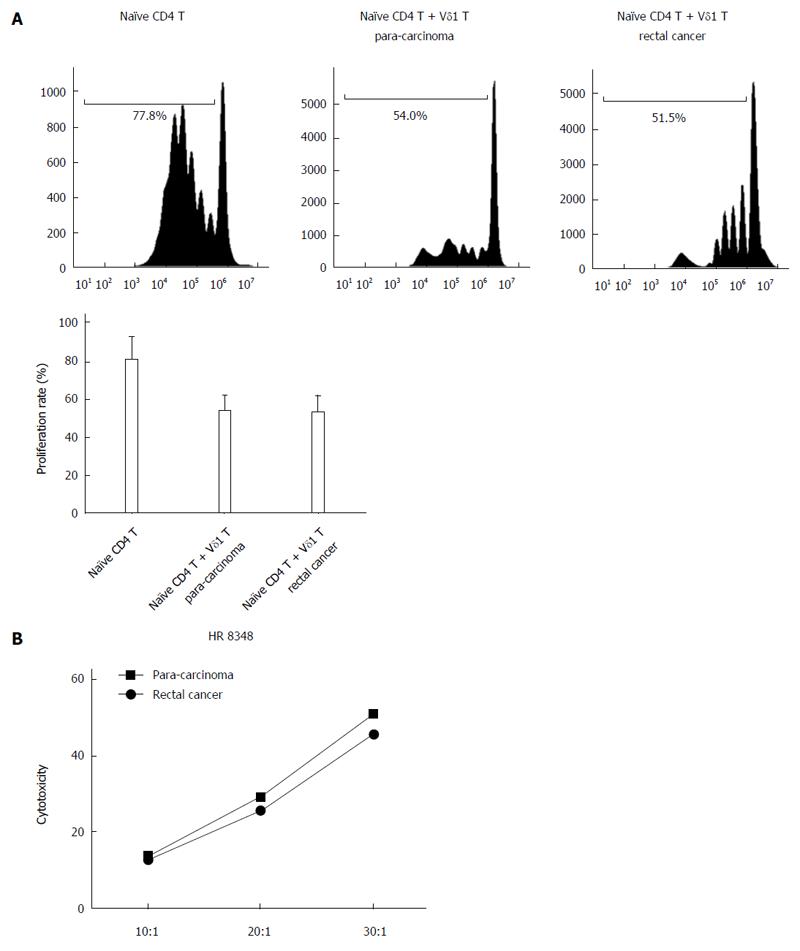
Figure 4 Functional analysis of Vδ1 and Vδ2 T cells from cancer tissues or para-carcinoma tissues.
A: Fresh naïve CD4 T cells were labeled with CFSE and co-cultured with Vδ1 T cells from cancer tissues or para-carcinoma tissues; B: Lysis of HR8348 cells by Vδ2 T cells at effector to target cell ratios (E:T) of 10:1, 20:1 and 40:1.
- Citation: Rong L, Li K, Li R, Liu HM, Sun R, Liu XY. Analysis of tumor-infiltrating gamma delta T cells in rectal cancer. World J Gastroenterol 2016; 22(13): 3573-3580
- URL: https://www.wjgnet.com/1007-9327/full/v22/i13/3573.htm
- DOI: https://dx.doi.org/10.3748/wjg.v22.i13.3573


