©The Author(s) 2016.
World J Gastroenterol. Mar 14, 2016; 22(10): 2949-2959
Published online Mar 14, 2016. doi: 10.3748/wjg.v22.i10.2949
Published online Mar 14, 2016. doi: 10.3748/wjg.v22.i10.2949
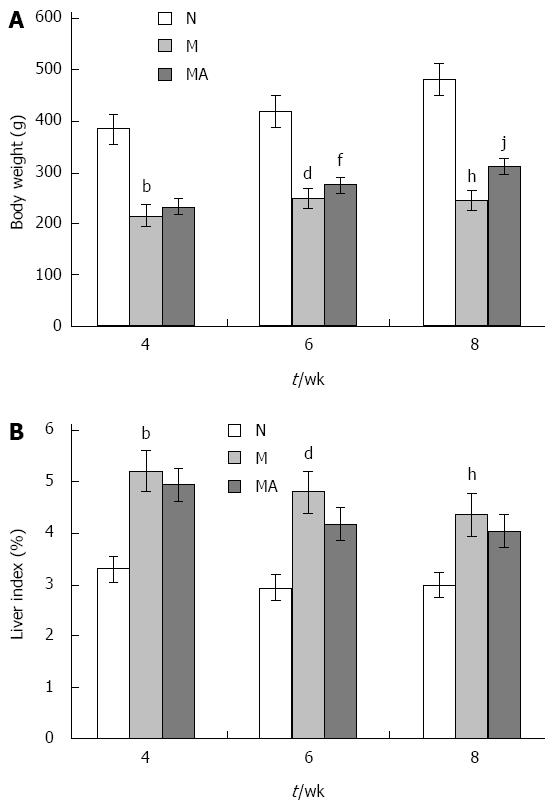
Figure 1 Body weight and organ indices in rats.
A: Body weight; B: Liver index. bP < 0.01 vs N group at 4 wk; dP < 0.01 vs N group at 6 wk; fP < 0.01 vs M group at 6 wk; hP < 0.01 vs N group at 8 wk; jP < 0.01 vs M group at 8 wk.
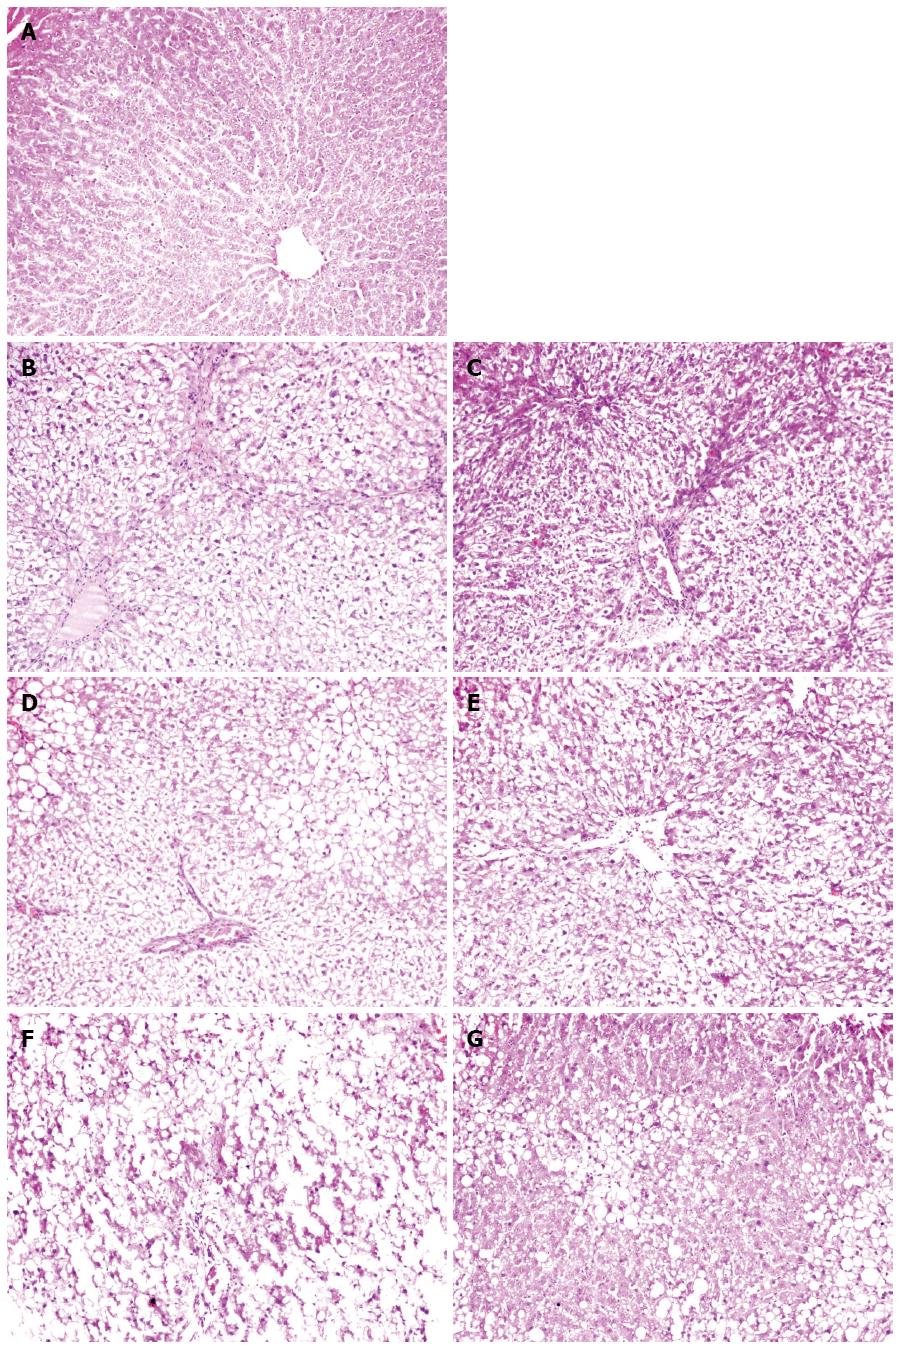
Figure 2 Histopathological changes of hepatic tissues as revealed by HE staining (n = 6, × 200).
A: N; B: M at 4 wk; C: MA at 4 wk; D: M at 6 wk; E: MA at 6 wk; F: M at 8 wk; G: MA at 8 wk.
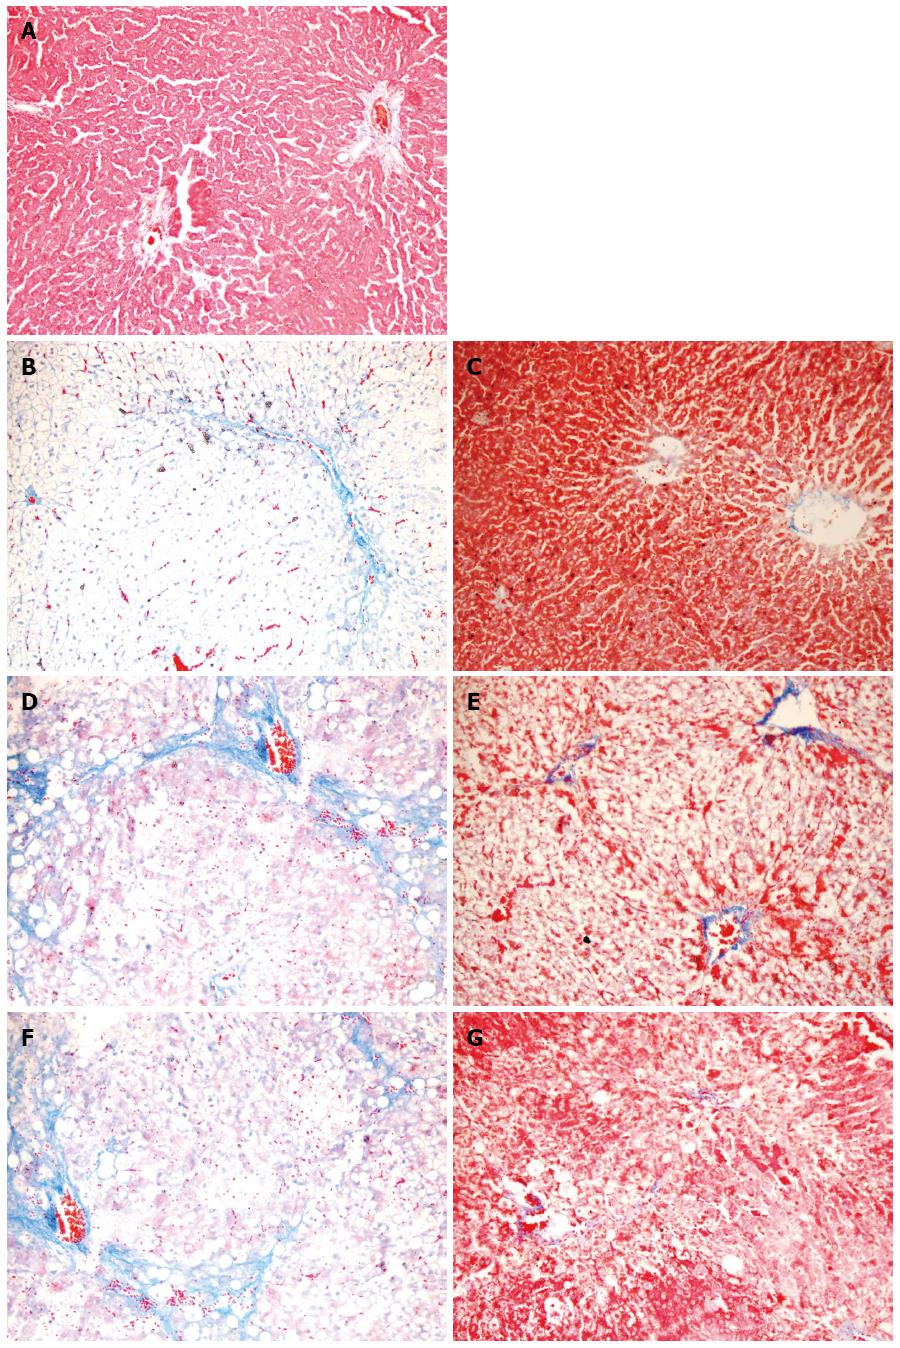
Figure 3 Histopathological changes of hepatic tissues as revealed by Masson’ trichrome staining (n = 6, × 200).
A: N; B: M at 4 wk; C: MA at 4 wk; D: M at 6 wk; E: MA at 6 wk; F: M at 8 wk; G: MA at 8 wk.
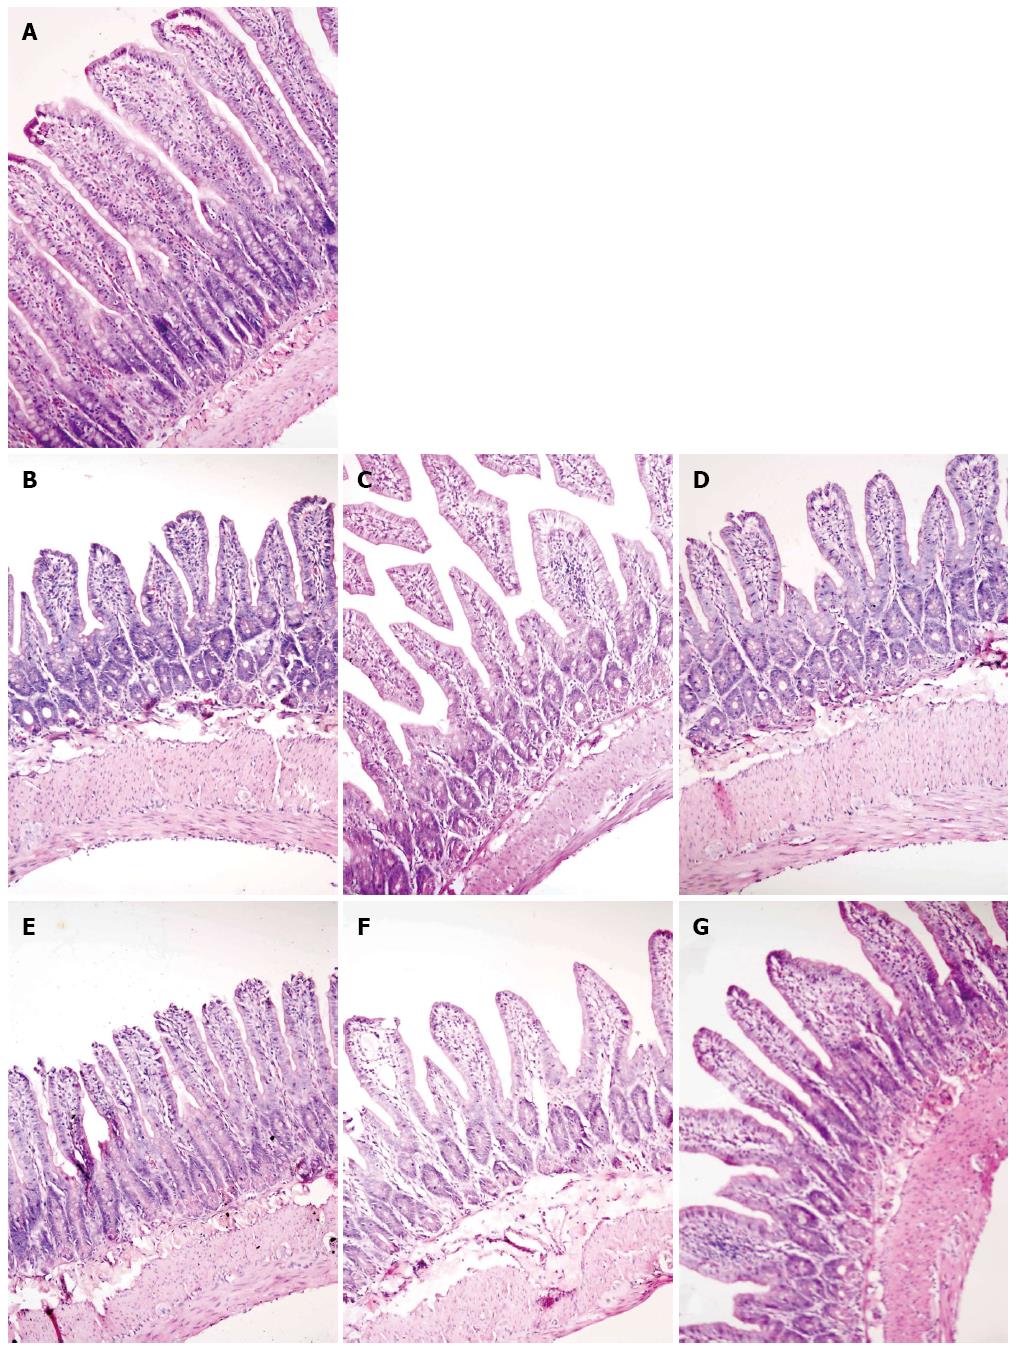
Figure 4 Histopathological change of small intestinal mucosa as revealed by HE staining (n = 6, × 200).
A: N; B: M at 4 wk; C: M at 6 wk; D: M at 8 wk; E: MA at 4 wk; F: MA at 6 wk; G: MA at 6 wk.
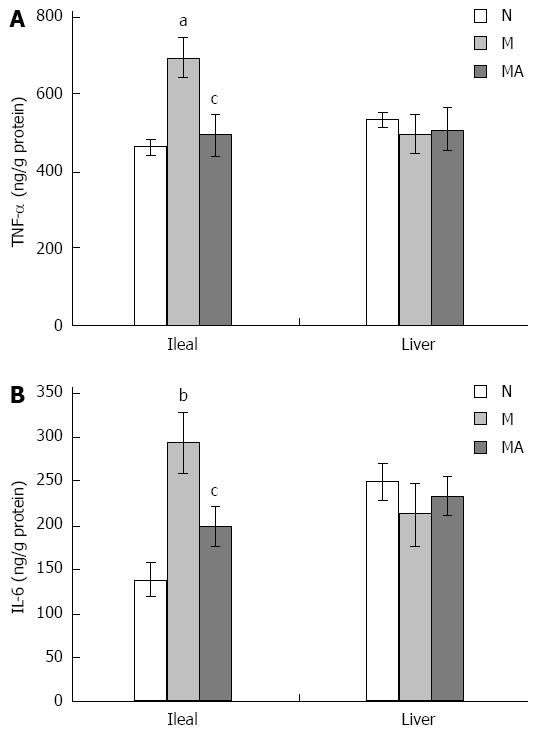
Figure 5 Levels of TNF-α and IL-6 in the tissue homogenates of liver and ileum (n = 6).
A: The levels of TNF-α; B: The levels of IL-6. aP < 0.05, bP < 0.01 vs N group; cP < 0.05 vs M group.
- Citation: Chen YX, Lai LN, Zhang HY, Bi YH, Meng L, Li XJ, Tian XX, Wang LM, Fan YM, Zhao ZF, Han DW, Ji C. Effect of artesunate supplementation on bacterial translocation and dysbiosis of gut microbiota in rats with liver cirrhosis. World J Gastroenterol 2016; 22(10): 2949-2959
- URL: https://www.wjgnet.com/1007-9327/full/v22/i10/2949.htm
- DOI: https://dx.doi.org/10.3748/wjg.v22.i10.2949


