©The Author(s) 2016.
World J Gastroenterol. Jan 7, 2016; 22(1): 417-426
Published online Jan 7, 2016. doi: 10.3748/wjg.v22.i1.417
Published online Jan 7, 2016. doi: 10.3748/wjg.v22.i1.417
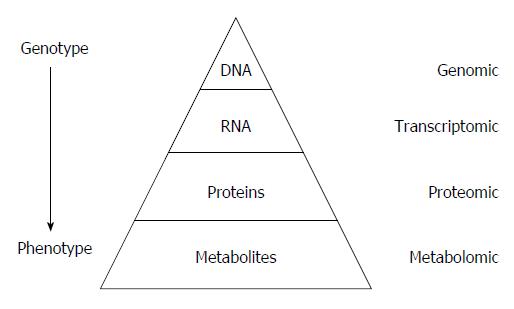
Figure 1 “Omic” techniques.
Schematic representation in biological system: Each functional level from the DNA, RNAs, Proteins and metabolites who constitute respectively the genome, transcriptome, proteome and metabolome, have bidirectional flow of information and complex interactions together and with the environment (diseases, drug, lifestyle, genre, habit, diet, etc.). Those interactions produce the phenotype that represents the final output of the system measured in metabolomics.
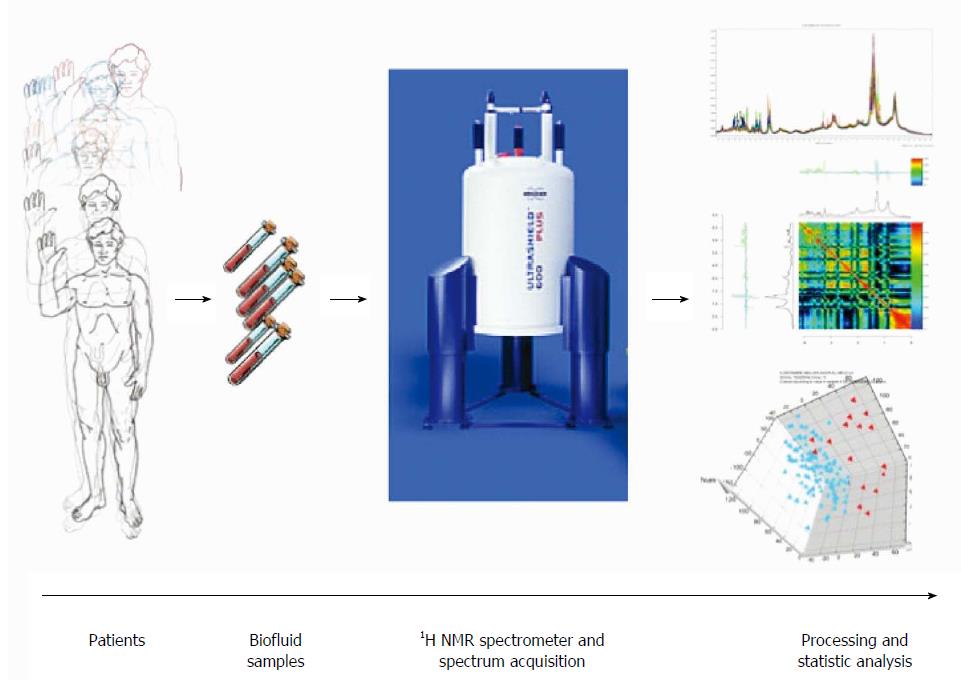
Figure 2 Schematic view of workflow for metabolomic studies: From bedside to bench.
Proposed standards for metabolomic approach are presented in this schematic view. Clinical question, selection of the population, standardized biofluid collection and conservation, biofluid preparation and spectra acquisition, pre-processing to clean the data for data processing, pre-treatment (i.e., scaling, centering, etc.) to transform the clean data to make them ready for data processing, data analysis (multivariate analysis, unsupervised and supervised analysis), metabolite identification and interpretation.
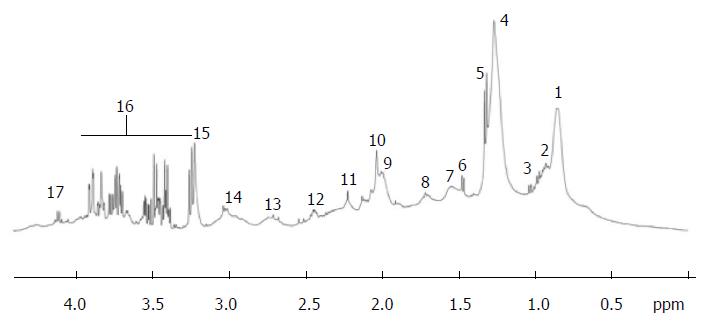
Figure 3 Typical proton nuclear magnetic resonance (500 MHz) spectra of the region between 0 and 6 ppm from cirrhotic patient.
Region between 4.5 and 5.0 ppm corresponding to the water and urea was suppressed. Peak assignment: 1: Fatty acids (-CH2-CH2-CH2-CH3); 2: Isoleucine; 3: Valine; 4: Fatty acids (-CH2-CH2-CH2-); 5: Lactate; 6: Alanine; 7: Fatty acids (-CH2-CH2-CO-); 8: Fatty acids (-CH2-CH2-CH=); 9: Fatty acids (=CH-CH2-CH2-); 10: Acetyl signals from α1-acid glycoprotein; 11: Fatty acids (-CH2-CO-); 12: Glutamine; 13: Fatty acids (=CH-CH2-CH=); 14: Albumin lysyl; 15: Choline; 16: Glucose; 17: Lactate; 18: Fatty acids (-CH=CH-). Adapted from Nahon et al[29].
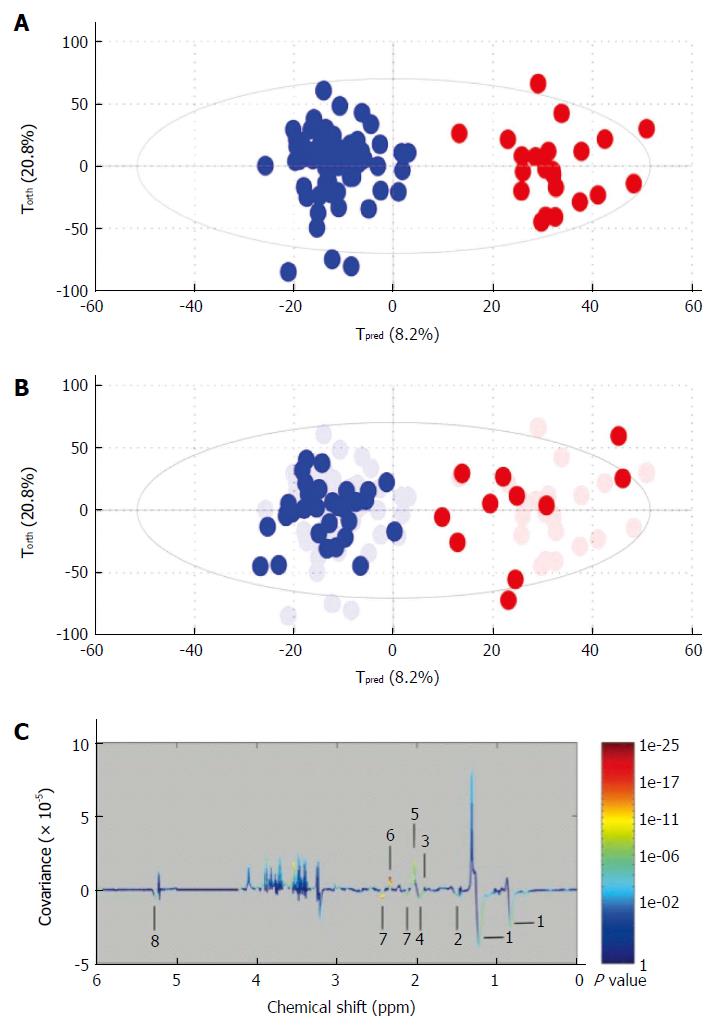
Figure 4 Example of metabolomic study using a training and test set to validate the model.
A: Creation of the model. On this Figure called score plot, each point represented the projection of an NMR spectrum (and thus one patient is sample) on both axes of the model. On this score plot, each dot corresponds to a spectrum colored according to the absence (blue) or the presence (red) of hepatocellular carcinoma (HCC). The constructed model provides a good distinction between the spectrum of cirrhotic patients without HCC and those with HCC; B: Validation of the model. Each new spectrum was projected in the score plot using the previously constructed model to enable prediction of the presence or absence of hepatocellular carcinoma (HCC). Each dot corresponds to a spectrum coloured depending on the absence (blue) or presence (red) of HCC; C: Discriminant metabolites. On this Figure called loading plot, variations of bucket intensities are represented using a line plot between 0 to 6 ppm. Positive signals correspond to the metabolites present at increased concentrations in patients with large HCC. Conversely, negative signals correspond to the metabolites present at increased concentrations in patients without HCC. 1: HDL; 2: Fatty acids; 3: Acetate; 4: Fatty acids; 5: N-acetyl-glycoprotein; 6: Glutamate; 7: Glutamine; 8: Fatty acids. Adapted from Nahon et al[29].
- Citation: Amathieu R, Triba MN, Goossens C, Bouchemal N, Nahon P, Savarin P, Le Moyec L. Nuclear magnetic resonance based metabolomics and liver diseases: Recent advances and future clinical applications. World J Gastroenterol 2016; 22(1): 417-426
- URL: https://www.wjgnet.com/1007-9327/full/v22/i1/417.htm
- DOI: https://dx.doi.org/10.3748/wjg.v22.i1.417


