©The Author(s) 2015.
World J Gastroenterol. Dec 21, 2015; 21(47): 13374-13385
Published online Dec 21, 2015. doi: 10.3748/wjg.v21.i47.13374
Published online Dec 21, 2015. doi: 10.3748/wjg.v21.i47.13374
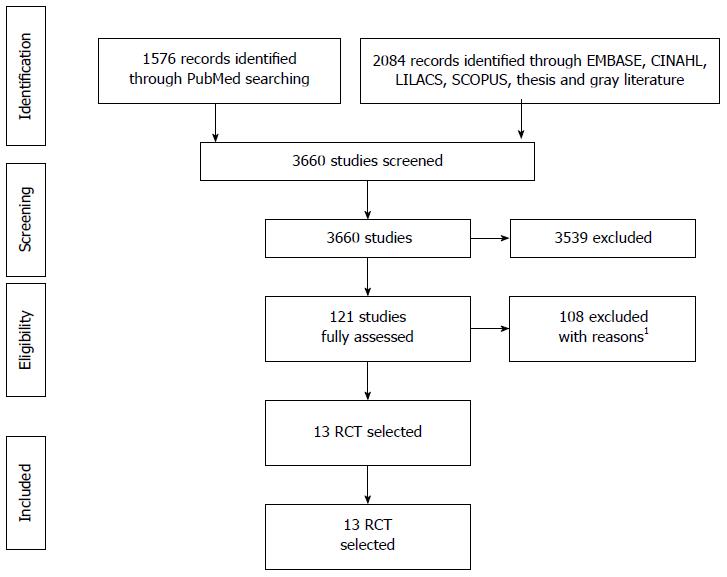
Figure 1 PRISMA’s studies selection fluxogram.
1The reasons for exclusions are displayed on Supplementary Table 1. RCT: Randomized clinical trials.
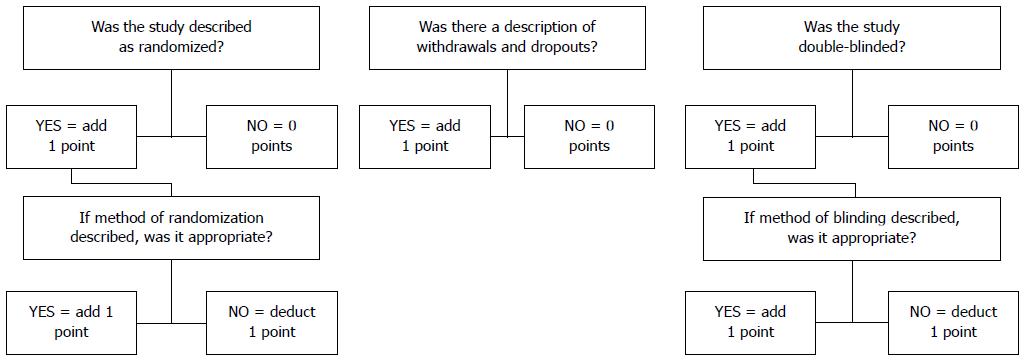
Figure 2 JADAD scale.
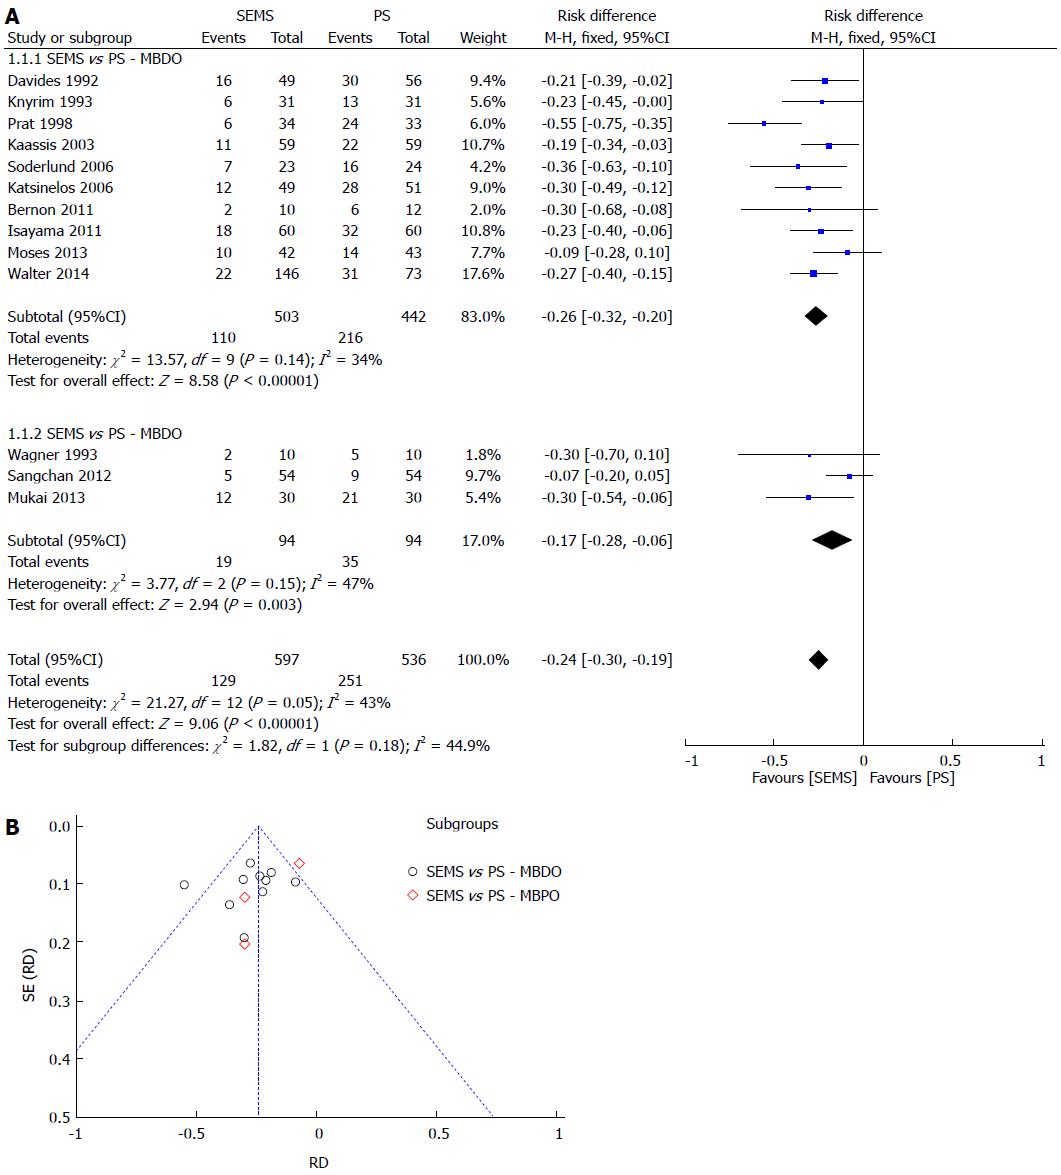
Figure 3 Stent dysfunction.
A: Forest plot; B: Funnel plot.
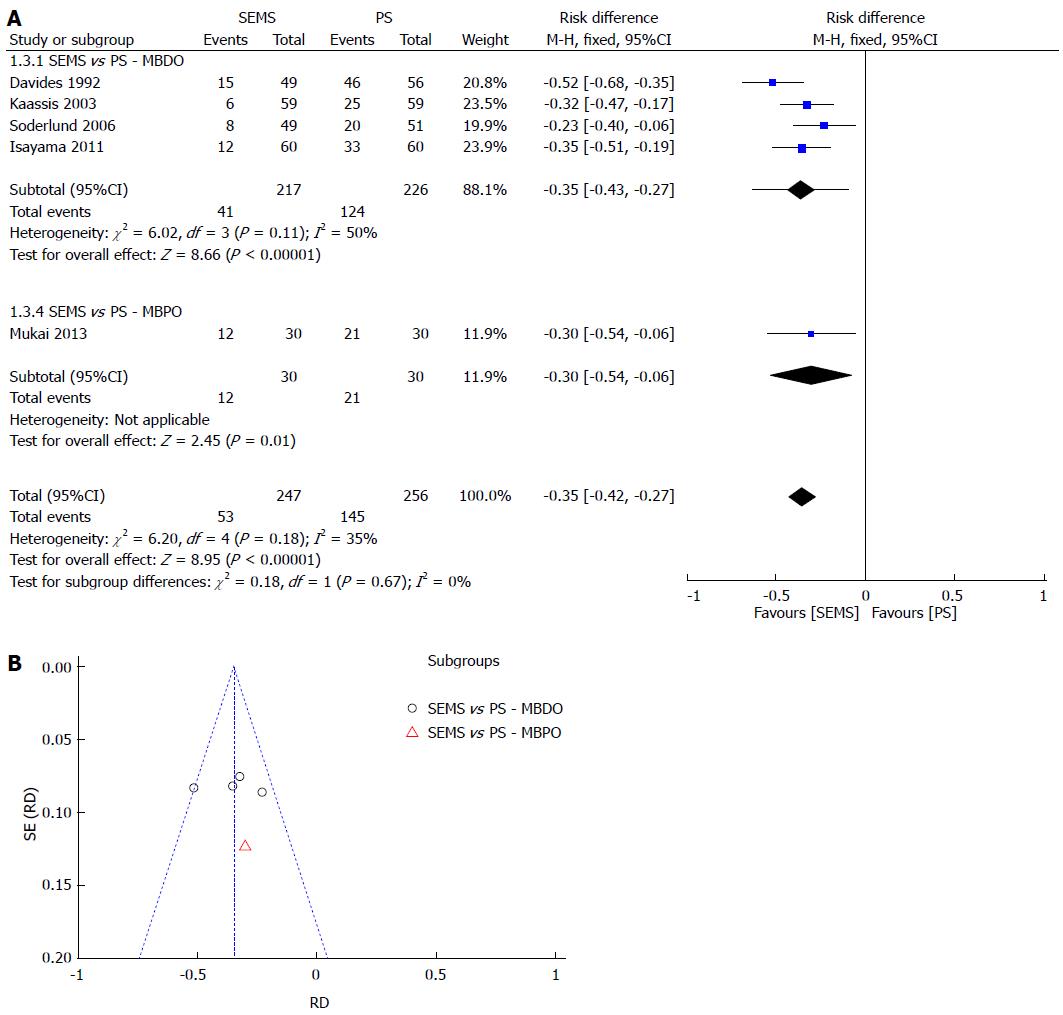
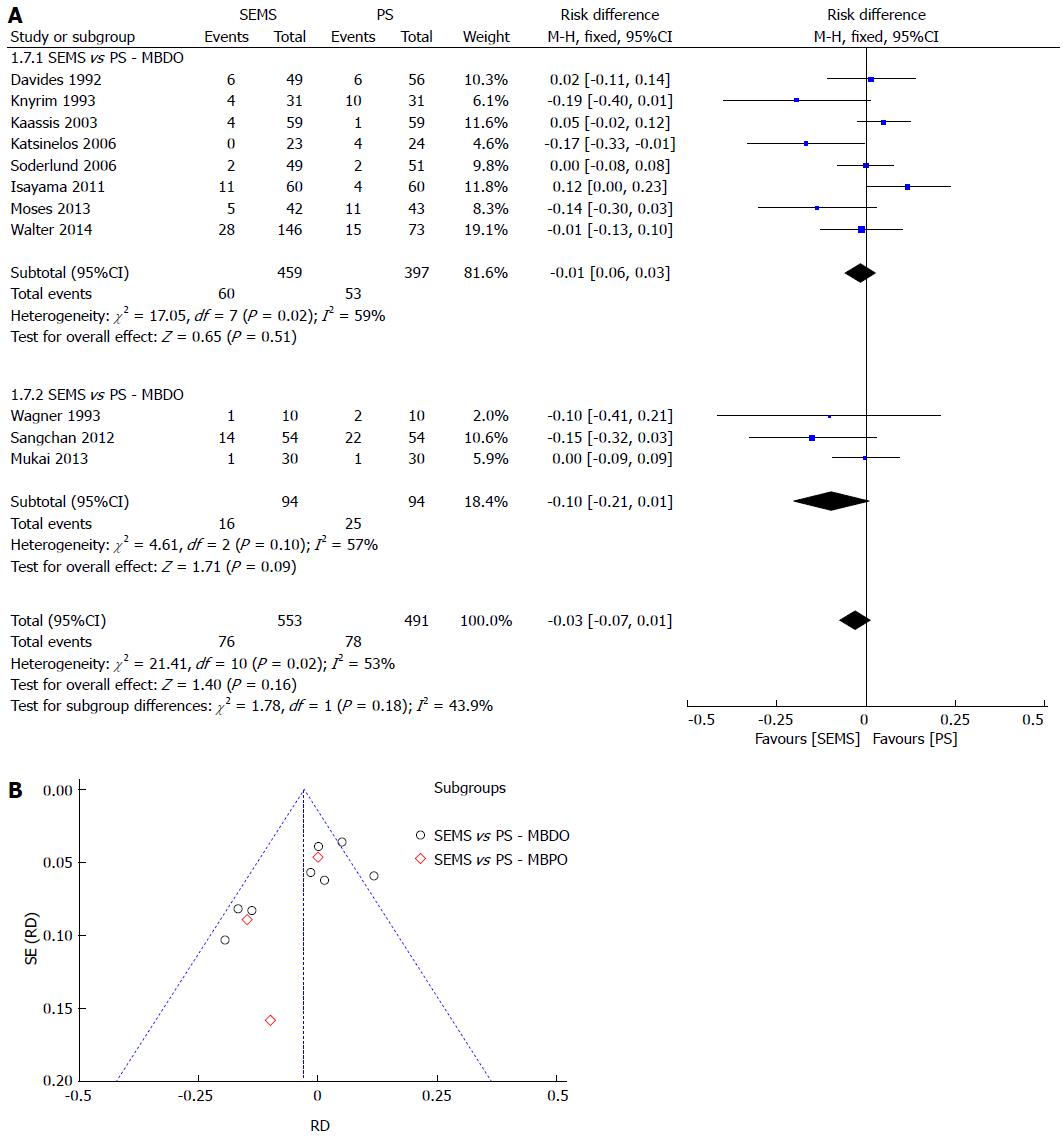
Figure 4 RE-INTERVENTION (dichotomic).
A: Forest plot; B: Funnel plot.
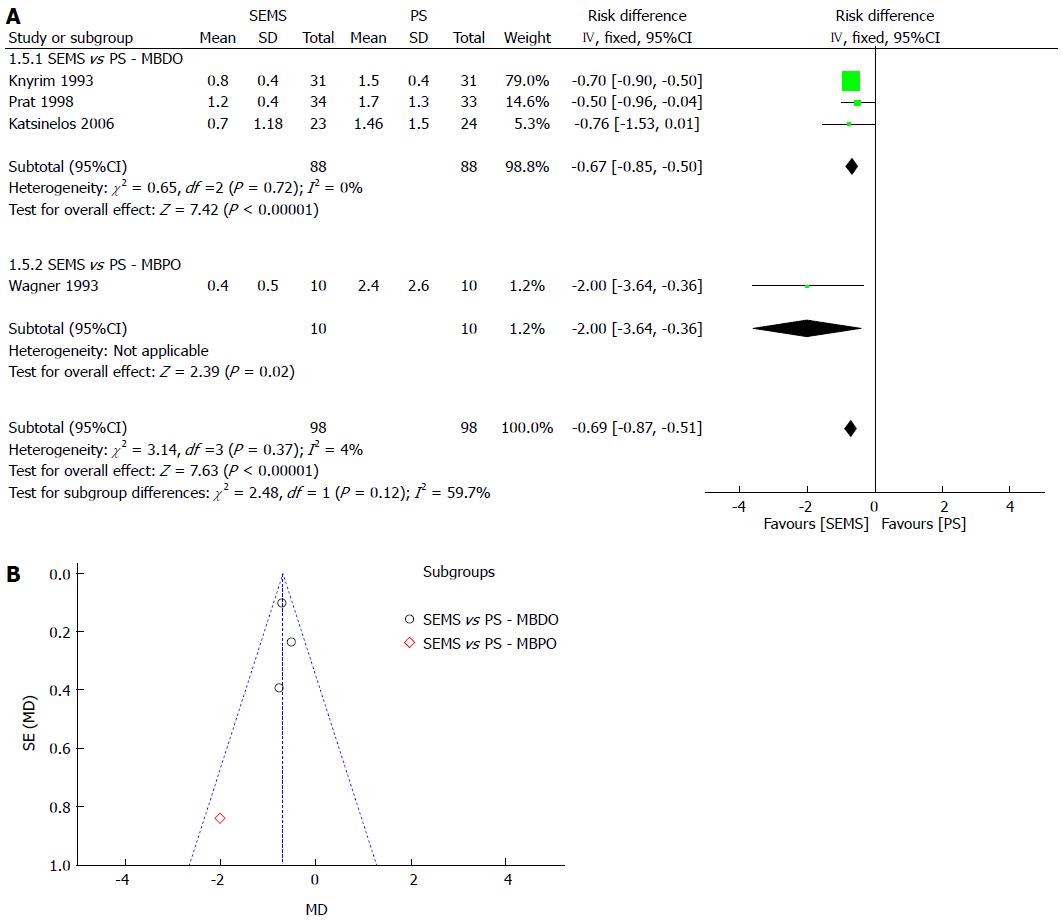
Figure 5 RE-INTERVENTION (continuous).
A: Forest plot; B: Funnel plot.
Figure 6 Complication.
A: Forest plot; B: Funnel plot.
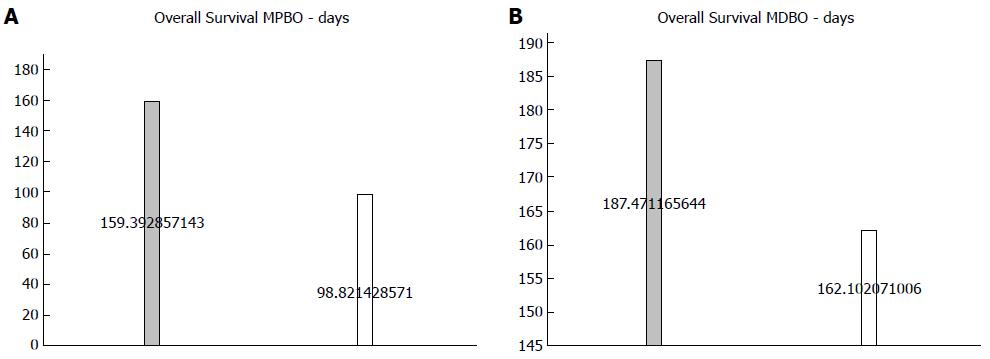
Figure 7 Mean survival by stent in patients (P < 0.
0001). A: With proximal tumors; B: With distal tumors.
- Citation: Zorrón Pu L, de Moura EGH, Bernardo WM, Baracat FI, Mendonça EQ, Kondo A, Luz GO, Furuya Júnior CK, Artifon ELA. Endoscopic stenting for inoperable malignant biliary obstruction: A systematic review and meta-analysis. World J Gastroenterol 2015; 21(47): 13374-13385
- URL: https://www.wjgnet.com/1007-9327/full/v21/i47/13374.htm
- DOI: https://dx.doi.org/10.3748/wjg.v21.i47.13374


