Copyright
©The Author(s) 2015.
World J Gastroenterol. Dec 14, 2015; 21(46): 13188-13194
Published online Dec 14, 2015. doi: 10.3748/wjg.v21.i46.13188
Published online Dec 14, 2015. doi: 10.3748/wjg.v21.i46.13188
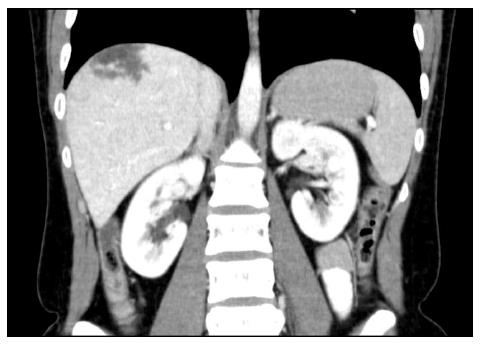
Figure 1 Computed tomography (arterial phase).
The lesion is composed of greater areas of low attenuation and shows an early acquisition of the contrast.
Figure 2 Magnetic resonance.
A: T2-weighted sequence. The lesion is as hyperintense as the remaining parenchyma with multiple foci of high-signal intensity; B: T1-weighted sequence. The lesion appears hypointense.
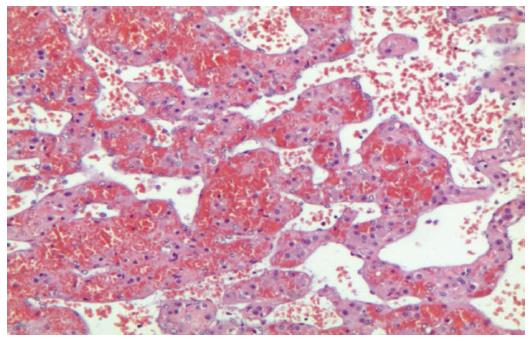
Figure 3 Hepatic tissue with pseudovascular pattern (without endothelium) filled with debris and erythrocytes.
Note the presence of rich intratissutal capillary vessels (Hematoxylin and eosin; magnification × 200).
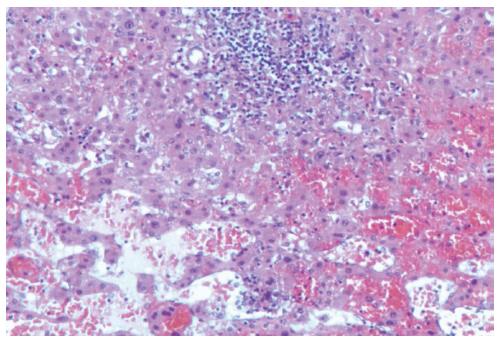
Figure 4 Pseudovascular spaces associated with reactive lymphoid aggregates with macrophage cells and tissutal hystiocytes (Hematoxylin and eosin, magnification × 200).
- Citation: Crocetti D, Palmieri A, Pedullà G, Pasta V, D’Orazi V, Grazi GL. Peliosis hepatis: Personal experience and literature review. World J Gastroenterol 2015; 21(46): 13188-13194
- URL: https://www.wjgnet.com/1007-9327/full/v21/i46/13188.htm
- DOI: https://dx.doi.org/10.3748/wjg.v21.i46.13188


