©The Author(s) 2015.
World J Gastroenterol. May 28, 2015; 21(20): 6352-6360
Published online May 28, 2015. doi: 10.3748/wjg.v21.i20.6352
Published online May 28, 2015. doi: 10.3748/wjg.v21.i20.6352
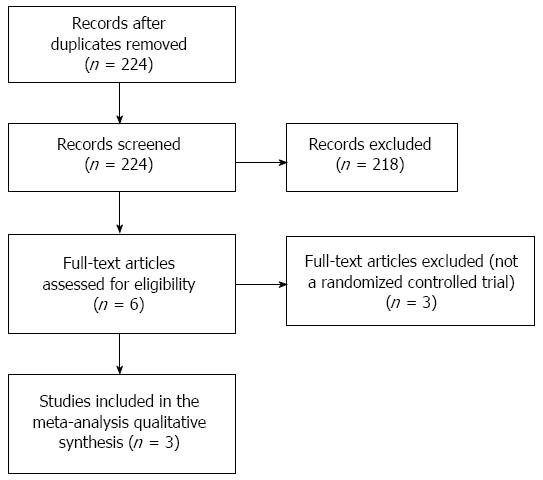
Figure 1 Flow diagram of study selection.
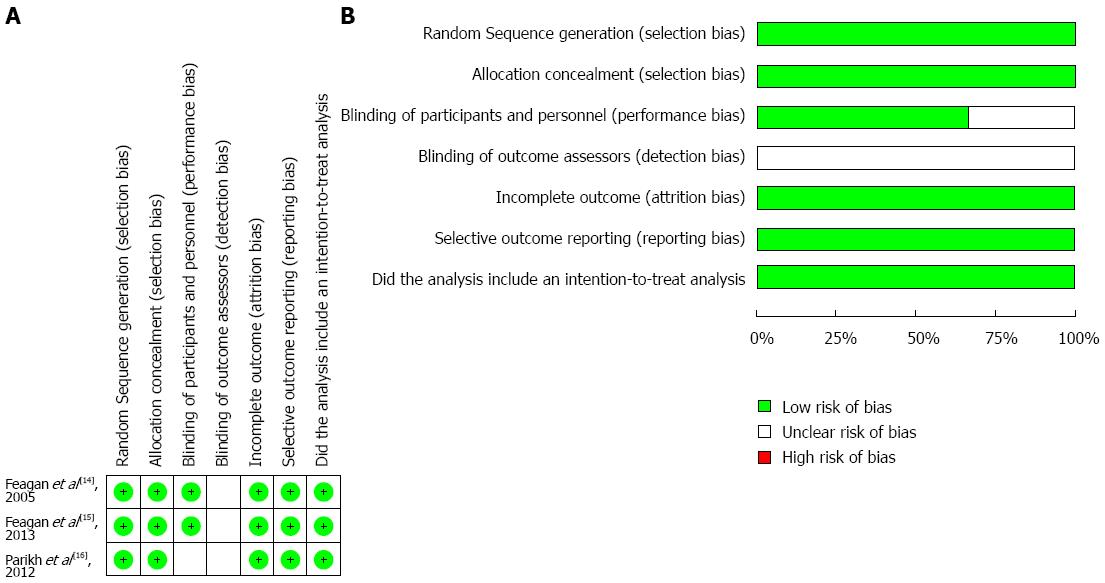
Figure 2 Quality assessments of included studies.
A: Risk of bias summary; B: Risk of bias graph.
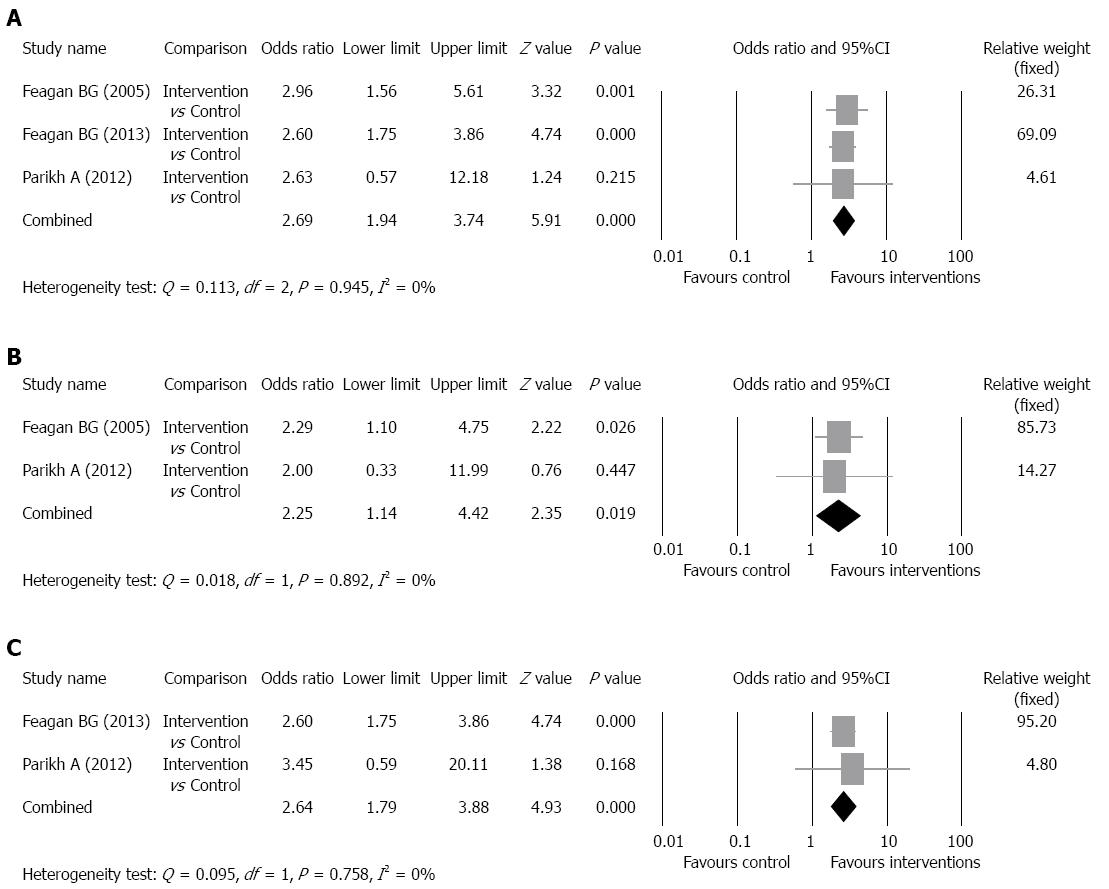
Figure 3 Forest plots of the meta-analysis of clinical response rate.
A: Pooled of all intervention groups; B: Drug dose: 2 mg/kg; C: Drug dose: 6 mg/kg.
Figure 4 Forest plot of the meta-analysis of clinical remission rate.
Figure 5 Forest plot of the meta-analysis of serious adverse events.
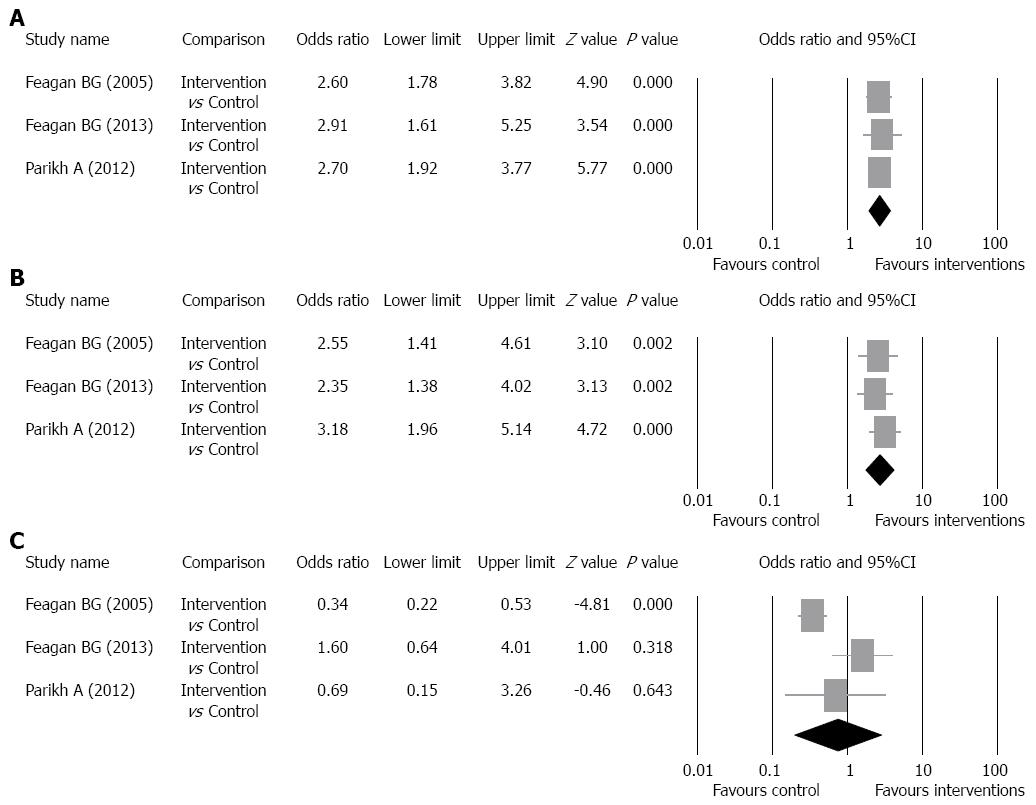
Figure 6 Sensitivity analysis for the influence of individual studies on pooled estimates as determined using the leave-one-out method.
A: Clinical response rate; B: Clinical remission rate; C: Serious adverse event rate.
- Citation: Jin Y, Lin Y, Lin LJ, Zheng CQ. Meta-analysis of the effectiveness and safety of vedolizumab for ulcerative colitis. World J Gastroenterol 2015; 21(20): 6352-6360
- URL: https://www.wjgnet.com/1007-9327/full/v21/i20/6352.htm
- DOI: https://dx.doi.org/10.3748/wjg.v21.i20.6352


