Copyright
©The Author(s) 2015.
World J Gastroenterol. May 7, 2015; 21(17): 5407-5416
Published online May 7, 2015. doi: 10.3748/wjg.v21.i17.5407
Published online May 7, 2015. doi: 10.3748/wjg.v21.i17.5407
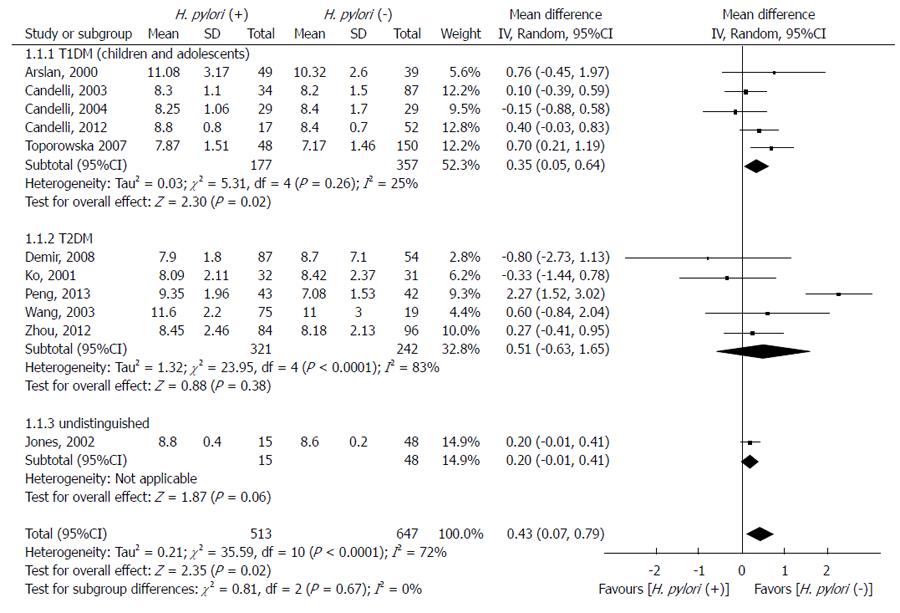
Figure 1 Helicobacter pylori infection and glycosylated hemoglobin levels in diabetic patients.
The forest plot demonstrates the positive association between Helicobacter pylori infection and HbA1c levels in children and adolescents with type 1 diabetes mellitus (T1DM) but not type 2 diabetes mellitus (T2DM). IV: Inverse variance.
Figure 2 Helicobacter pylori infection and fasting plasma glucose levels in type 2 diabetes mellitus patients.
The forest plot demonstrates the positive association between Helicobacter pylori infection and fasting plasma glucose levels in type 2 diabetes mellitus patients. The studies included were not homogeneous. IV: Inverse variance.
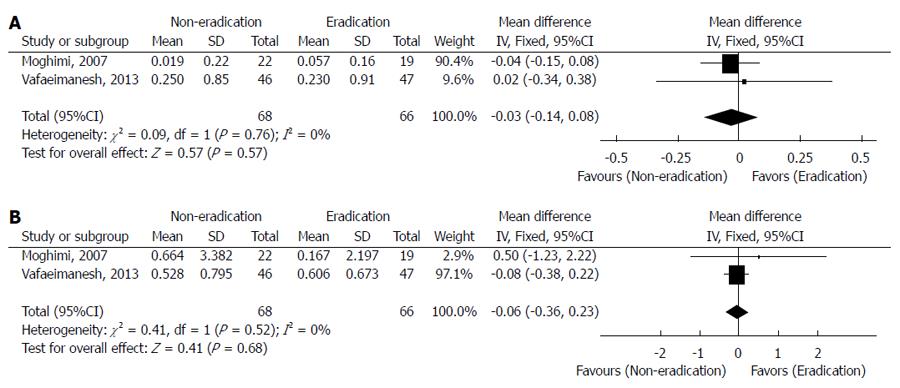
Figure 3 Effect of Helicobacter pylori eradication on glycemic control in type 2 diabetes mellitus patients.
A: Glycosylated hemoglobin decrease (%); B: Fasting plasma glucose decrease (mmol/L). The forest plot demonstrates that eradication of Helicobacter pylori did not improve glycemic control in type 2 diabetes mellitus patients in a 3-mo follow-up period. IV: Inverse variance.
Figure 4 Helicobacter pylori reinfection and glycosylated hemoglobin levels in type 1 diabetes mellitus patients.
The forest plot demonstrates the positive association between Helicobacter pylori re-infection and glycosylated hemoglobin levels in type 1 diabetes mellitus patients. IV: Inverse variance.
Figure 5 Funnel plots for publication bias.
Each dot represents the mean difference for glycosylated hemoglobin level (A) or fasting plasma glucose level (B) in Helicobacter pylori-positive and Helicobacter pylori-negative diabetics.
-
Citation: Dai YN, Yu WL, Zhu HT, Ding JX, Yu CH, Li YM. Is
Helicobacter pylori infection associated with glycemic control in diabetics? World J Gastroenterol 2015; 21(17): 5407-5416 - URL: https://www.wjgnet.com/1007-9327/full/v21/i17/5407.htm
- DOI: https://dx.doi.org/10.3748/wjg.v21.i17.5407


