Copyright
©The Author(s) 2015.
World J Gastroenterol. May 7, 2015; 21(17): 5259-5270
Published online May 7, 2015. doi: 10.3748/wjg.v21.i17.5259
Published online May 7, 2015. doi: 10.3748/wjg.v21.i17.5259
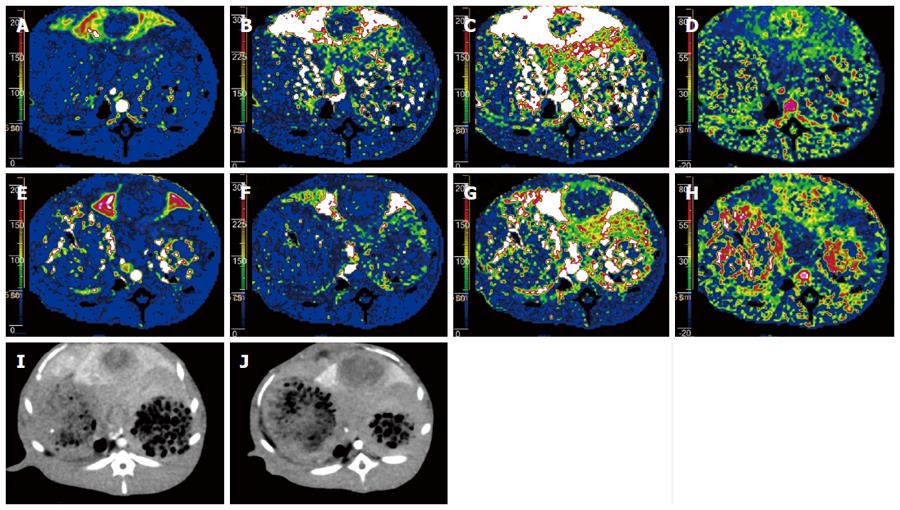
Figure 1 Computed tomography perfusions using both 80 kVp protocol with iterative reconstruction (4 mL Visipaque 270, 354.
1 mgI/kg) and 120 kVp protocol with filtered back projection (5 mL Omnipaque 350, 573.8 mgI/kg) at a 24-h interval were performed for liver VX2 tumor in a rabbit (body weight, 3.05 kg). A-D: Pseudocolor perfusion maps with the 80 kVp protocol and iterative reconstruction for HAP, HPP, HBF and HPI, respectively; E-H: Pseudocolor perfusion maps with the 120 kVp protocol and FBP for HAP, HPP, HBF, and HPI, respectively; I,J: Arterial phase images obtained using the 80 kVp protocol with iterative reconstruction and 120 kVp protocol reveal a markedly enhanced mass with central necrotic change, respectively. Computed tomography perfusion maps obtained using low tube potential with low concentration contrast medium depict a hypervascular mass with central hypovascular component, which is comparable to that obtained using the conventional tube potential and concentration contrast medium protocol. IR: Iterative reconstruction; FBP: Filtered back projection; HAP: Hepatic arterial perfusion; HPP: Hepatic portal perfusion; HBP: Hepatic blood flow; HPI: Hepatic perfusion index.
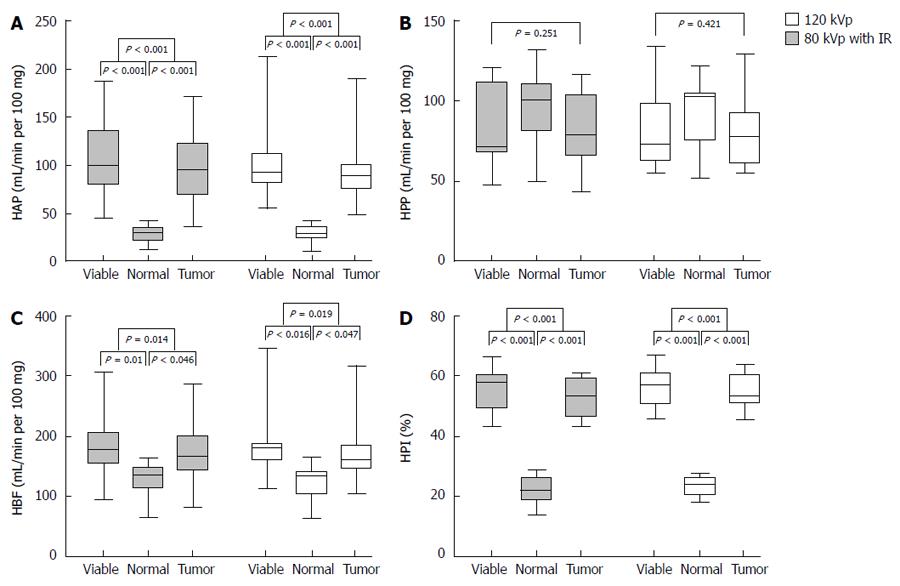
Figure 2 Box-and-whisker plots of hepatic arterial perfusion (A), hepatic portal perfusion (B), hepatic blood flow (C) and hepatic perfusion index (D) values were obtained with the 80 kVp protocol and iterative reconstruction and 120 kVp protocol to assess the difference in perfusion parameters among normal liver parenchyma, viable tumor and whole tumor (Donnut test, normal liver parenchyma set as control).
Center lines in box represent mean HAP, HPP, HBF and HPI values with upper and lower box margins denoting maximum and minimum percentile of values, respectively. Whiskers gives the range of values. IR: Iterative reconstruction; HAP: Hepatic arterial perfusion; HPP: Hepatic portal perfusion; HBP: Hepatic blood flow; HPI: Hepatic perfusion index; HBF: Hepatic blood flow.
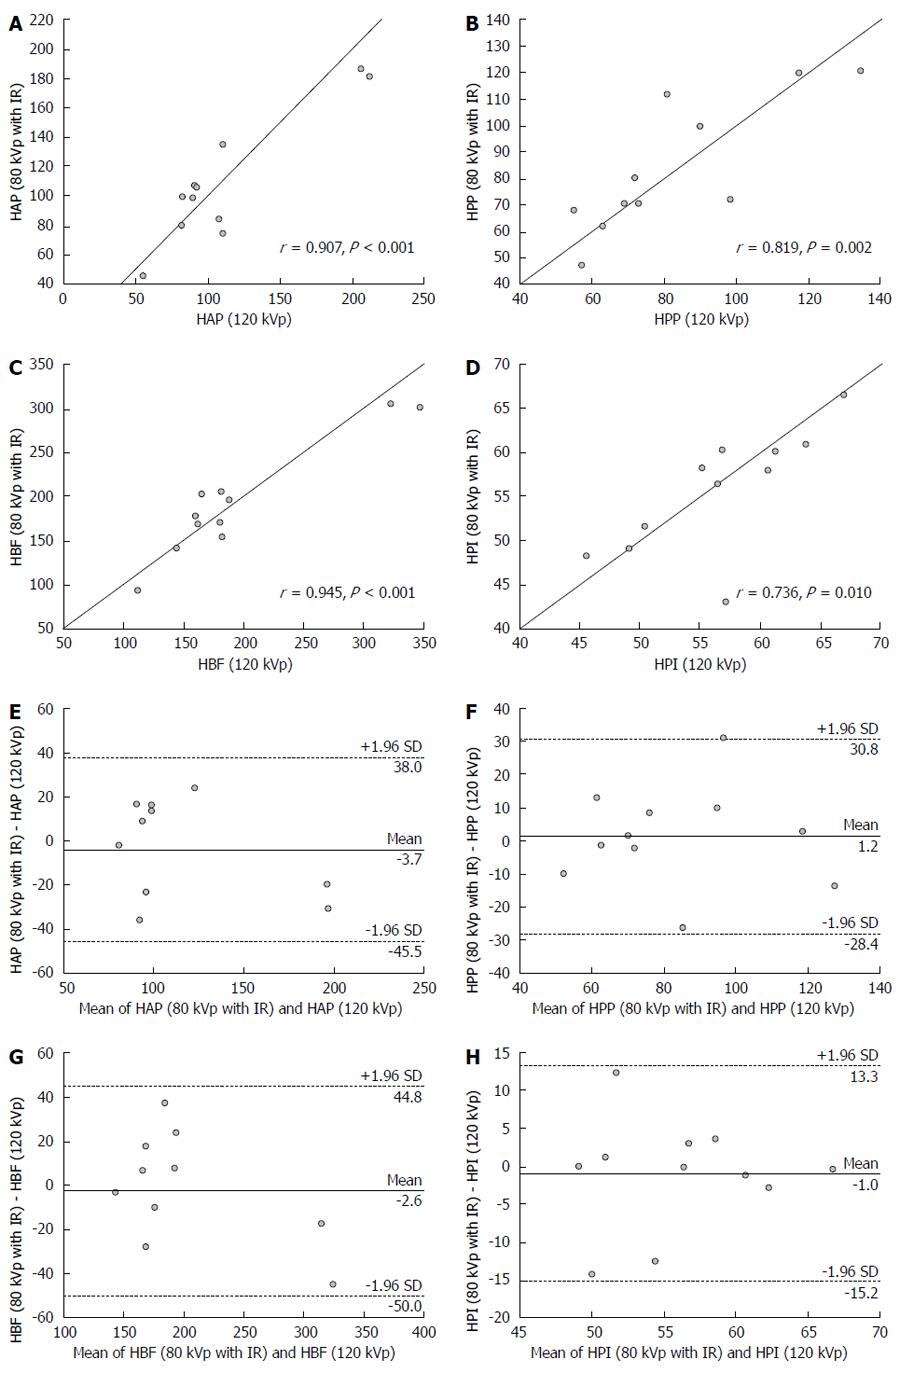
Figure 3 Correlation and agreement of perfusion parameters for viable tumor component obtained using the 80 kVp protocol with iterative reconstruction (low radiation dose and concentration contrast medium) and 120 kVp protocol with filtered back projection (conventional radiation dose and concentration contrast medium).
A: HAP; B: HPP; C: HBF; D: HPI; E: HAP-HAP; F: HPP-HPP; G: HBF-HBF; H: HPI-HPI. IR: Iterative reconstruction; HAP: Hepatic arterial perfusion; HPP: Hepatic portal perfusion; HBF: Hepatic blood flow; HPI: Hepatic perfusion index.
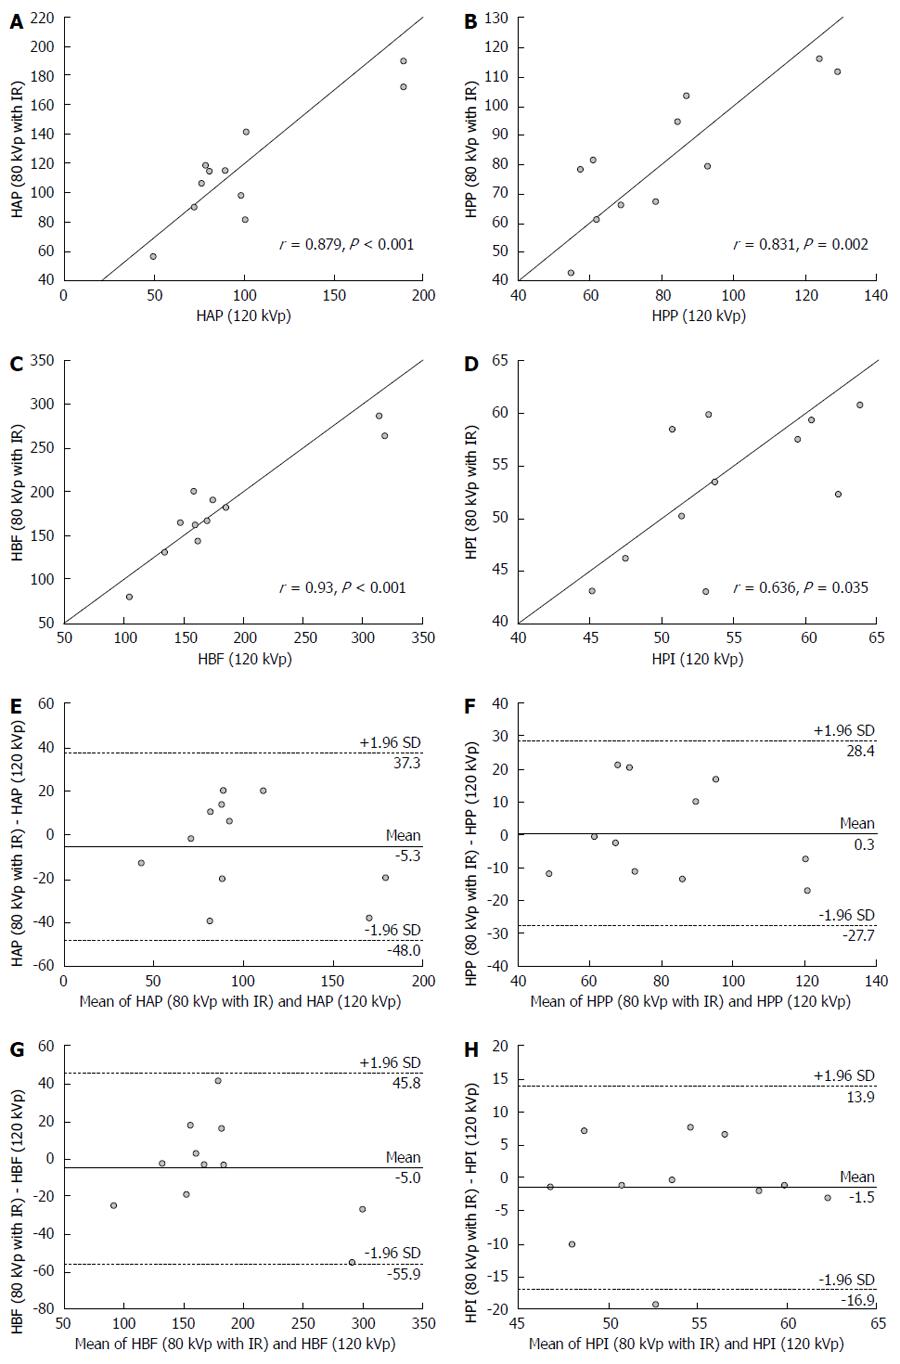
Figure 4 Correlation and agreement of perfusion parameters for whole tumor obtained using the 80 kVp protocol with iterative reconstruction (low radiation dose and concentration contrast medium) and 120 kVp protocol with filtered back projection (conventional radiation dose and concentration contrast medium).
A: HAP; B: HPP; C: HBF; D: HPI; E: HAP-HAP; F: HPP-HPP; G: HBF-HBF; H: HPI-HPI. IR: Iterative reconstruction; HAP: Hepatic arterial perfusion; HPP: Hepatic portal perfusion; HBF: Hepatic blood flow; HPI: Hepatic perfusion index.
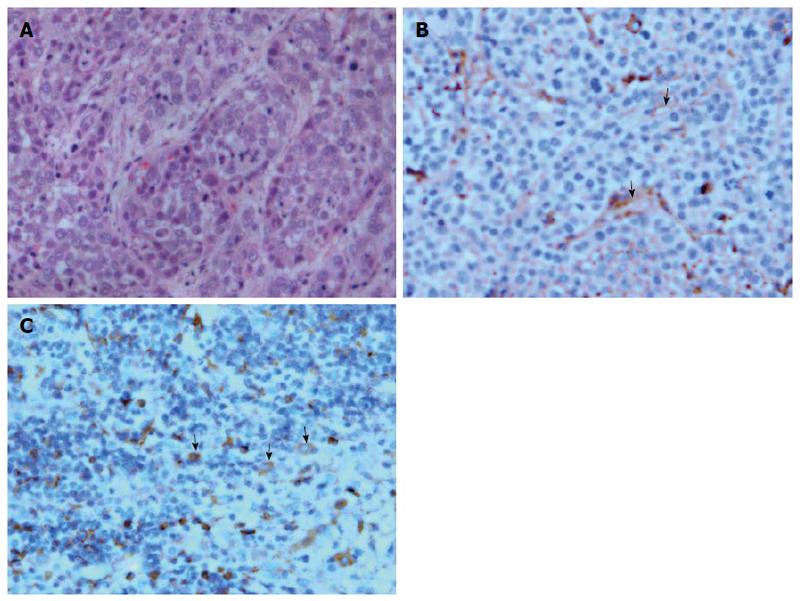
Figure 5 Histological and immunohistochemical micrographs of hepatic VX2 tumor.
A: Tumor tissue stained with hematoxylin and eosin (magnification × 400) demonstrates that the normal hepatic sinusoidal capillary disappeared and was replaced by a large amount of tumor cells; B: CD31 staining of tumor tissue shows the formation of new microvessels with incomplete layer of endothelial wall (arrows, magnification × 400); C: Vascular endothelial growth factor staining of tumor tissue depicts positive expression in the cytoplasm of tumor cell (arrows, magnification × 400).
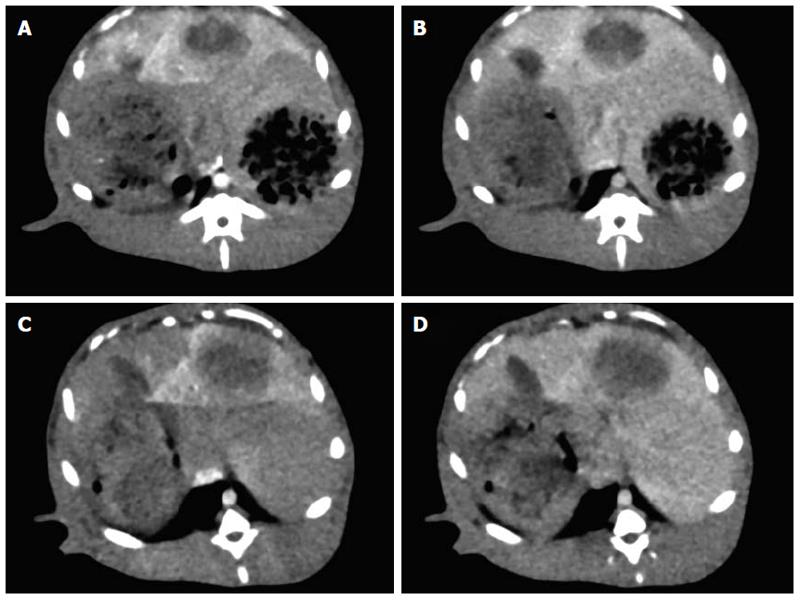
Figure 6 Computed tomography perfusions using both 80 kVp protocol with iterative reconstruction (4 mL Visipaque 270, 354.
1 mgI/kg) and 120 kVp protocol with filtered back projection (5 mL Omnipaque 350, 573.8 mgI/kg) at a 24-h interval were performed for liver VX2 tumor in a rabbit (body weight, 3.05 kg). A: Arterial phase image (80 kVp protocol); B: Portal venous phase image (80 kVp protocol); C: Arterial phase image (120 kVp protocol); D: Portal venous phase image (120 kVp protocol).
- Citation: Zhang CY, Cui YF, Guo C, Cai J, Weng YF, Wang LJ, Wang DB. Low contrast medium and radiation dose for hepatic computed tomography perfusion of rabbit VX2 tumor. World J Gastroenterol 2015; 21(17): 5259-5270
- URL: https://www.wjgnet.com/1007-9327/full/v21/i17/5259.htm
- DOI: https://dx.doi.org/10.3748/wjg.v21.i17.5259


