Copyright
©The Author(s) 2015.
World J Gastroenterol. Apr 28, 2015; 21(16): 4946-4953
Published online Apr 28, 2015. doi: 10.3748/wjg.v21.i16.4946
Published online Apr 28, 2015. doi: 10.3748/wjg.v21.i16.4946
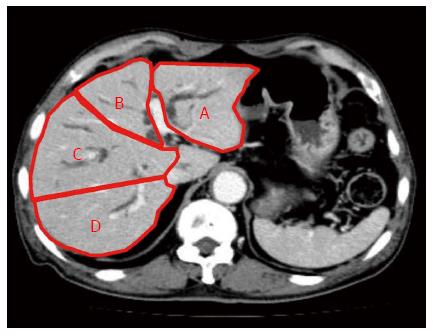
Figure 1 Computed tomography volumetric identification of liver sections.
Lateral section (A) and medial section (B) of the left liver, and anterior section (C) and posterior section (D) of the right liver.
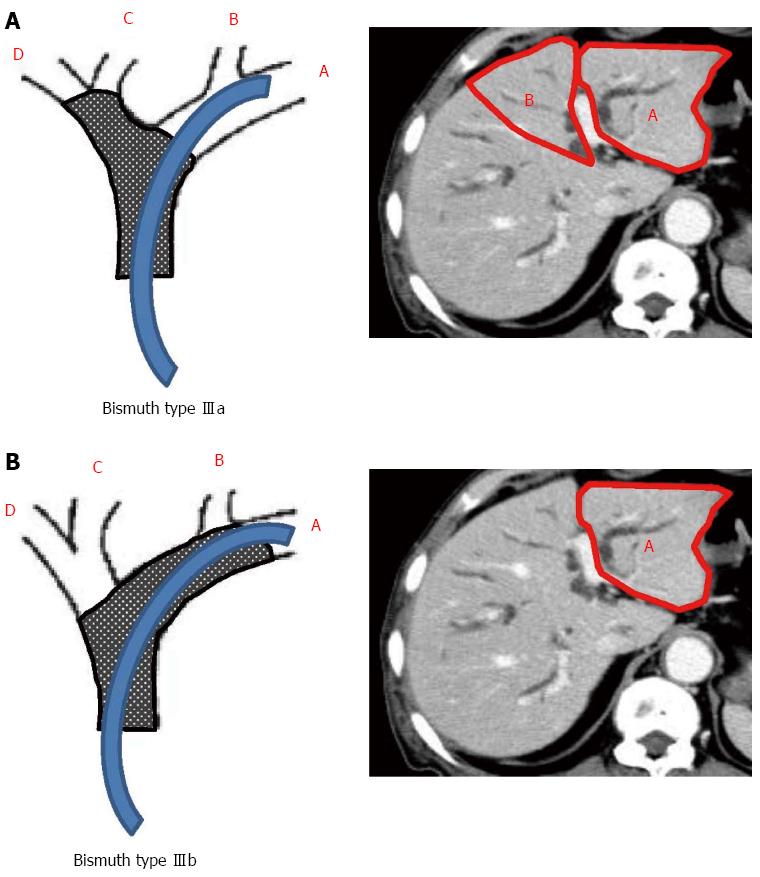
Figure 2 Calculation of drained liver volume according to the Bismuth classification.
The stent is inserted into the left hepatic duct. Drained volume is calculated as a sum of A + B in Bismuth type IIIa (A) and A in Bismuth type IIIb (B).
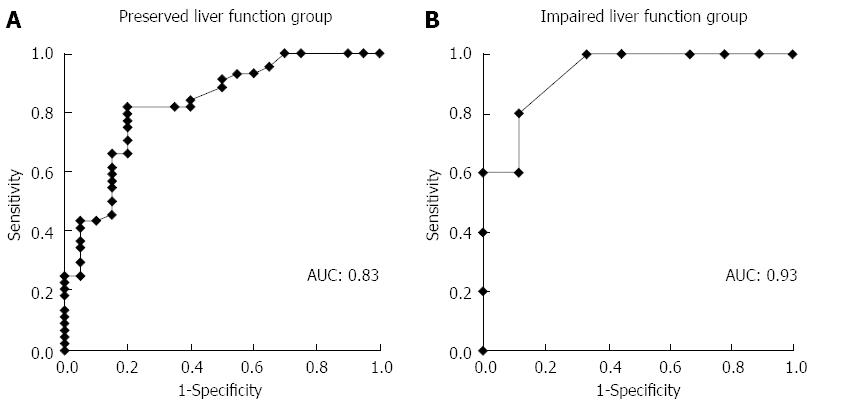
Figure 3 Area under the receiver operating characteristic curve for predicting effective drainage.
Area under the curve in subjects with preserved liver function (with normal liver or compensated liver cirrhosis) (A) and with impaired liver function (with decompensated liver cirrhosis) (B) is 0.83 and 0.93, respectively. AUC: Area under the curve.
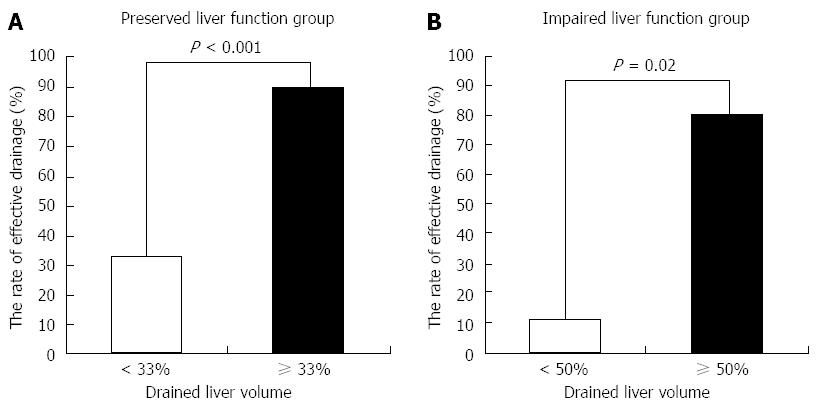
Figure 4 Rate of effective drainage and drained liver volume.
The rate is significantly higher in patients with drainage ≥ 33% of liver volume in subjects with preserved liver function (A) and with drainage ≥ 50% of liver volume in subjects with impaired liver function (B).
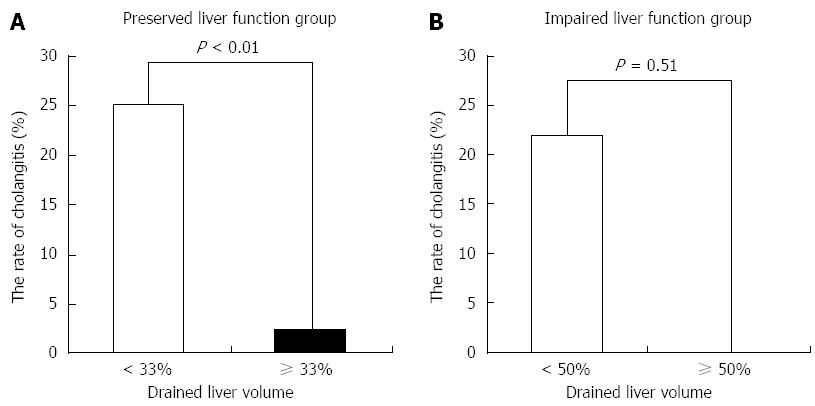
Figure 5 Rate of drainage-associated cholangitis and drained liver volume.
There is significant difference between the rate of cholangitis and drained liver volume in subjects with preserved liver function (A), but no significant difference in those with impaired liver function (B).
- Citation: Takahashi E, Fukasawa M, Sato T, Takano S, Kadokura M, Shindo H, Yokota Y, Enomoto N. Biliary drainage strategy of unresectable malignant hilar strictures by computed tomography volumetry. World J Gastroenterol 2015; 21(16): 4946-4953
- URL: https://www.wjgnet.com/1007-9327/full/v21/i16/4946.htm
- DOI: https://dx.doi.org/10.3748/wjg.v21.i16.4946


