Copyright
©The Author(s) 2015.
World J Gastroenterol. Apr 28, 2015; 21(16): 4864-4874
Published online Apr 28, 2015. doi: 10.3748/wjg.v21.i16.4864
Published online Apr 28, 2015. doi: 10.3748/wjg.v21.i16.4864
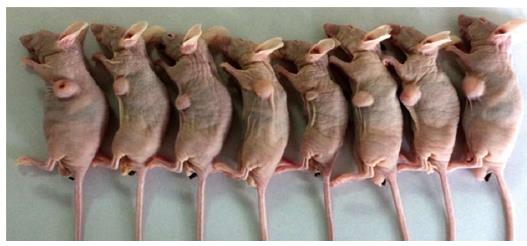
Figure 1 Establishment of mouse model with CBRH-7919 cells.
A xenograft tumor is apparent in the subcutaneous abdominal region.
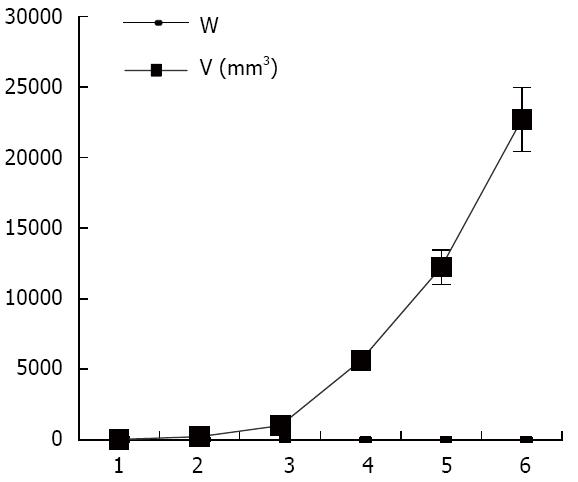
Figure 2 Tumor growth curve determined by the international veterinary information service system.
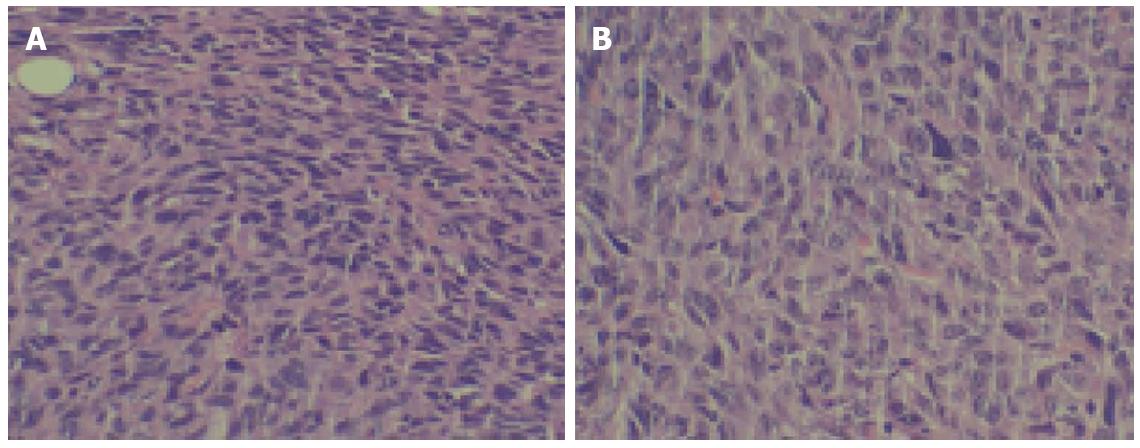
Figure 3 Tumor tissues from nude mice were stained with hematoxylin and eosin.
A: Tumor tissue (× 200); B: Peritumor tissue (× 200).
Figure 4 Inflammatory cell infiltration in tumors compared to adjacent peritumoral tissues.
A, C, E: Peritumoral tissues; B: Increased macrophage infiltrate in tumor tissue; D: Increased neutrophil infiltrate in tumor tissue; F: CD25+, activated T cells were increased in tumor tissue.
Figure 5 Hierarchical clustering analysis and line plots of genes with altered expression in tumor tissues compared with peritumoral tissues.
Expression profiles of chemokine-associated genes were obtained using a PCR microarray. Two-dimensional hierarchical clusters were prepared in GeneSpring 6.1 and Gene Tree View using these gene expression profiles. Red: Upregulation; Green: Downregulation.
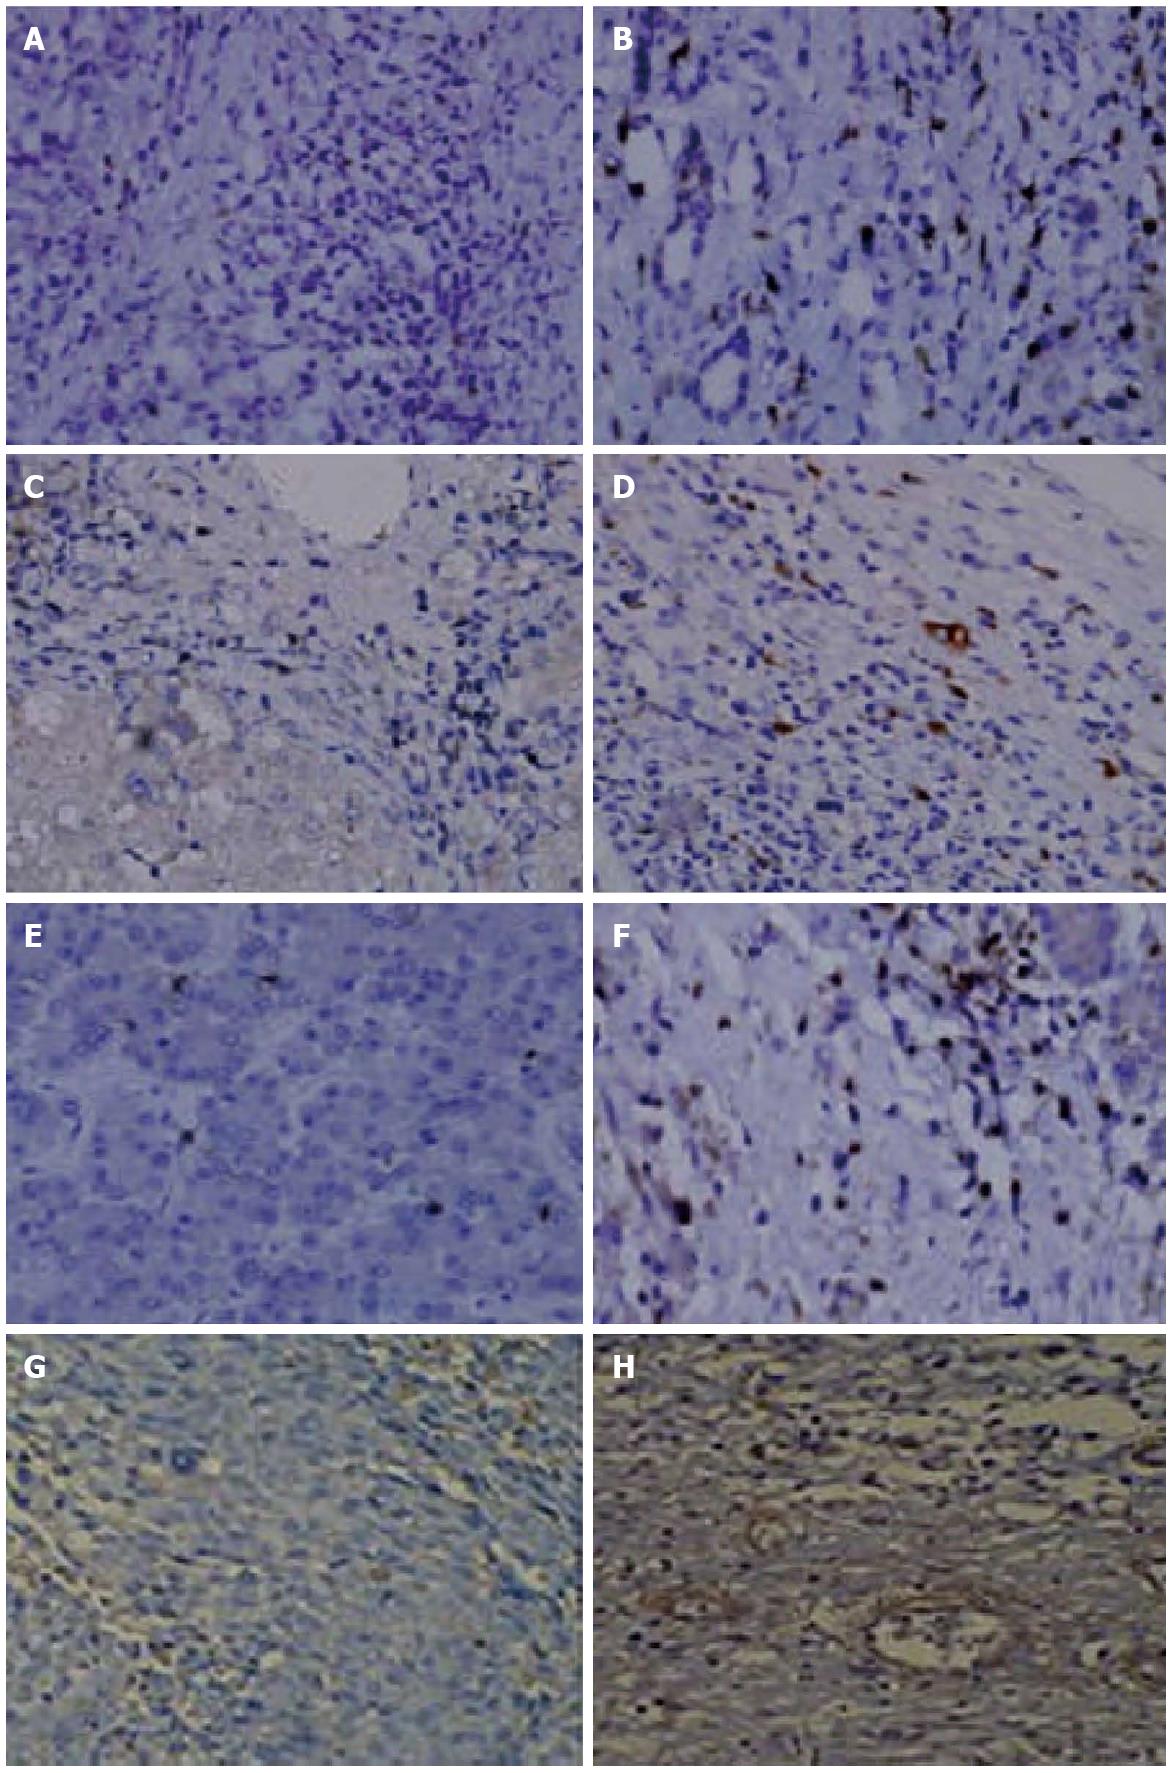
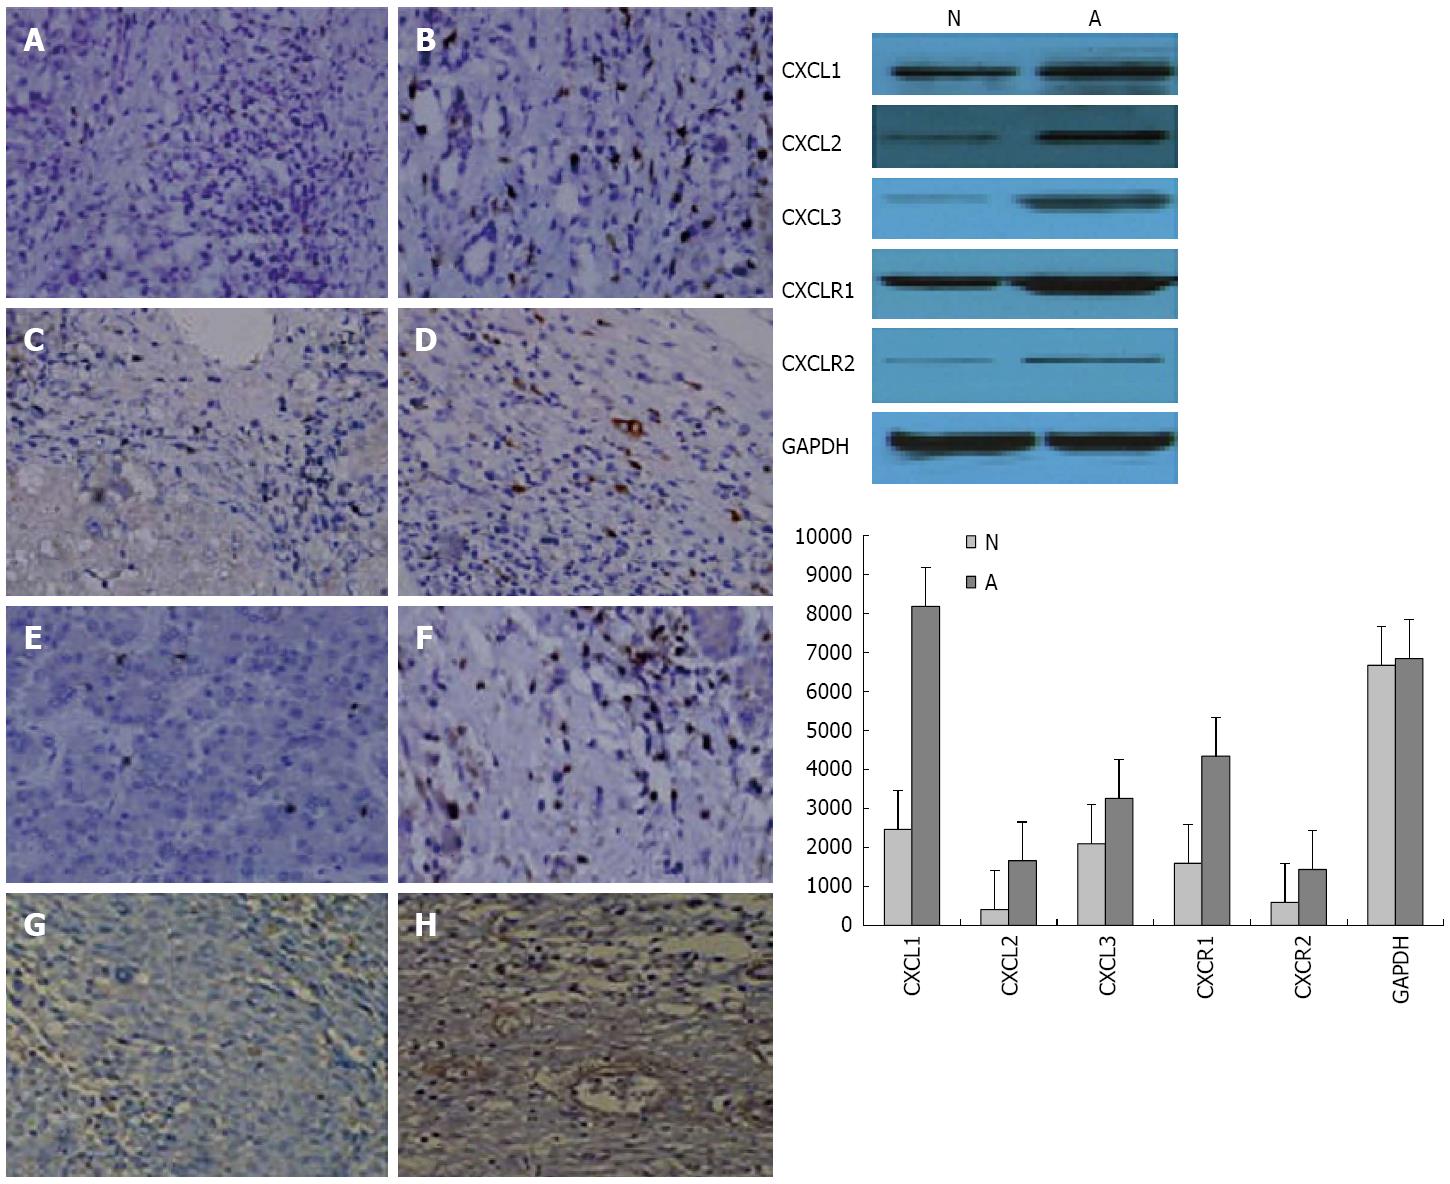
Figure 6 CXCL1, CXCL2, CXCL3, and CXCR1 expression in carcinoma cells xenografted into nude mice.
Immunostaining for A, B: CXCL1; C, D: CXCL2; E, F; CXCL3; and G, H: CXCR1 in pertumoral (A, C, E and G) and tumor (B, D, F and H) tissues (× 200). Western blot analyses of the tumor and peritumoral tissues from the CBRH-7919 cell line or shown to the right in tumor (N) and peritumoral (A) tissues.
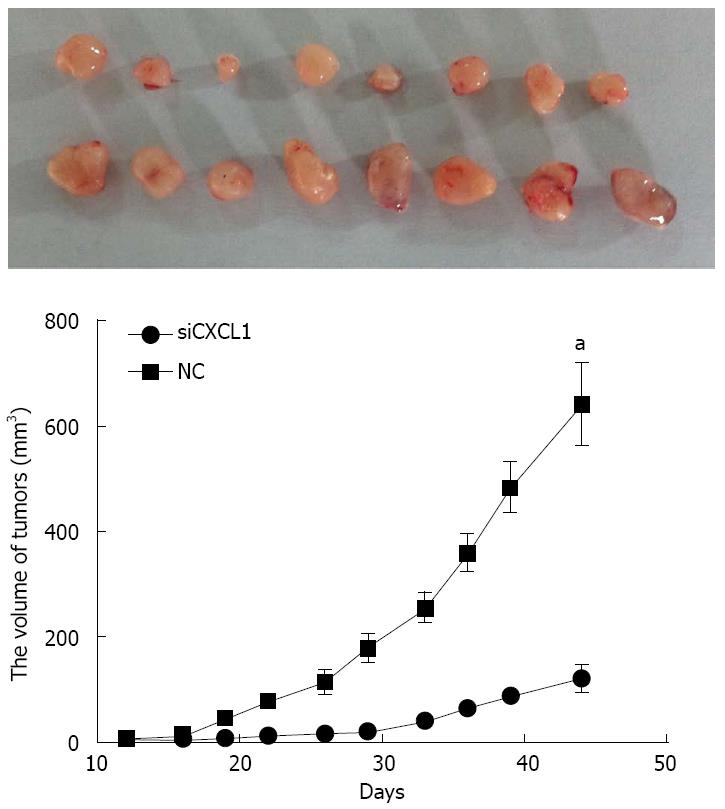
Figure 7 Growth CBRH-7919 xenografts with silencing of CXCL1.
Tumor growth curve was determined by the International Veterinary Information Service system. All data are expressed as mean ± SD; aP < 0.05 vs control (NC). shCXCL1: Short hairpin RNA targeting CXCL1.
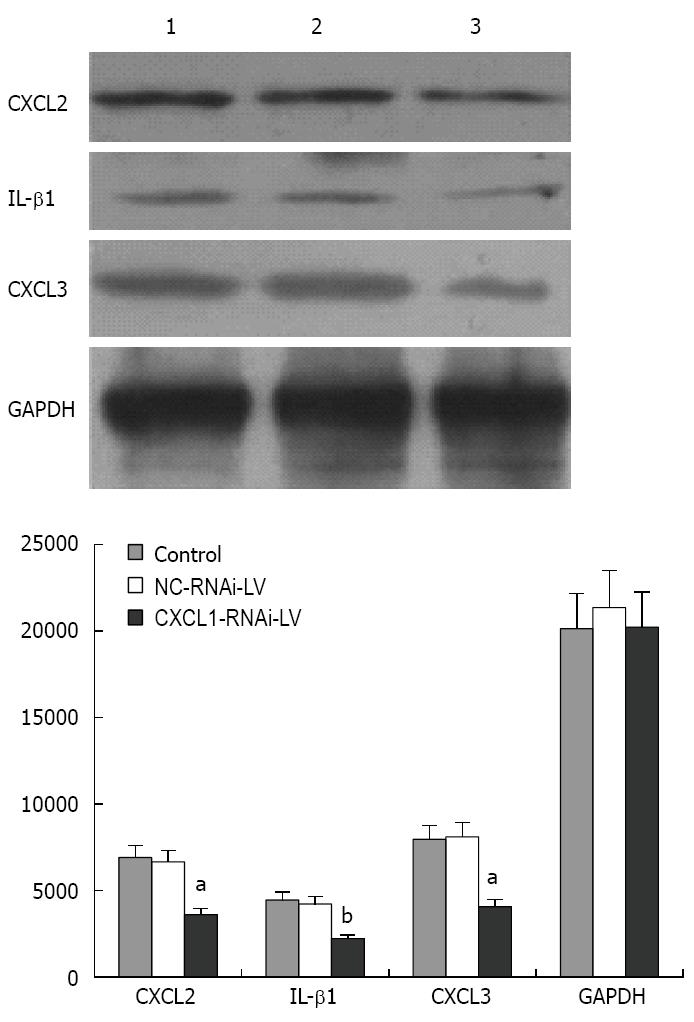
Figure 8 Expression of CXCL2, CXCL3 and IL-1β with CXCL1 silencing.
Representative Western blot showing expression in control untreated (1), control RNA interference (NC-RNAi-LV; 2), and CXCL1-targeted RNA interference (CXCL1-RNAi-LV; 3) groups; aP < 0.05, bP < 0.01 vs control.
- Citation: Han KQ, He XQ, Ma MY, Guo XD, Zhang XM, Chen J, Han H, Zhang WW, Zhu QG, Nian H, Ma LJ. Inflammatory microenvironment and expression of chemokines in hepatocellular carcinoma. World J Gastroenterol 2015; 21(16): 4864-4874
- URL: https://www.wjgnet.com/1007-9327/full/v21/i16/4864.htm
- DOI: https://dx.doi.org/10.3748/wjg.v21.i16.4864


