Copyright
©The Author(s) 2015.
World J Gastroenterol. Apr 21, 2015; 21(15): 4607-4619
Published online Apr 21, 2015. doi: 10.3748/wjg.v21.i15.4607
Published online Apr 21, 2015. doi: 10.3748/wjg.v21.i15.4607
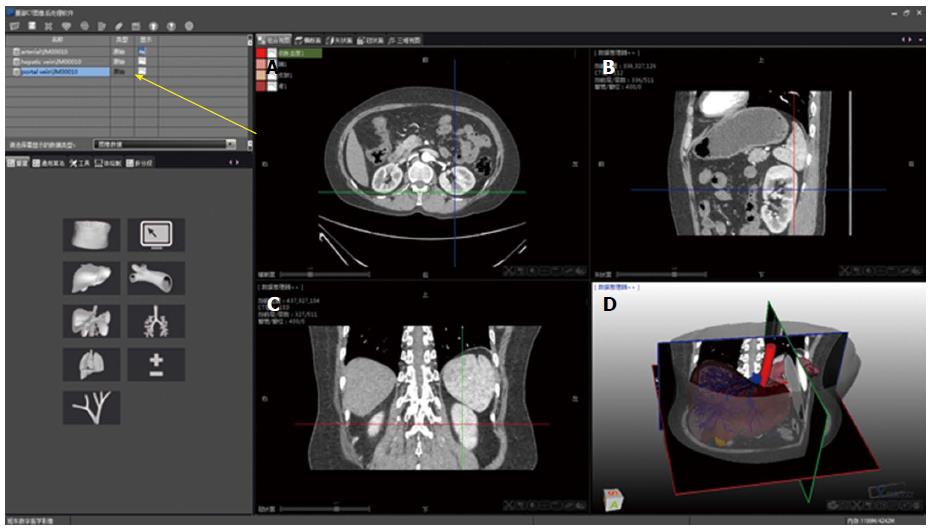
Figure 1 Data processing environment (yellow arrow) was demonstrated by the DMIT software package, and each module encapsulated a specific function.
A: Transverse; B: Sagittal; C: Coronal sections were dissected and reconstructed on its D: Graphic user interface.
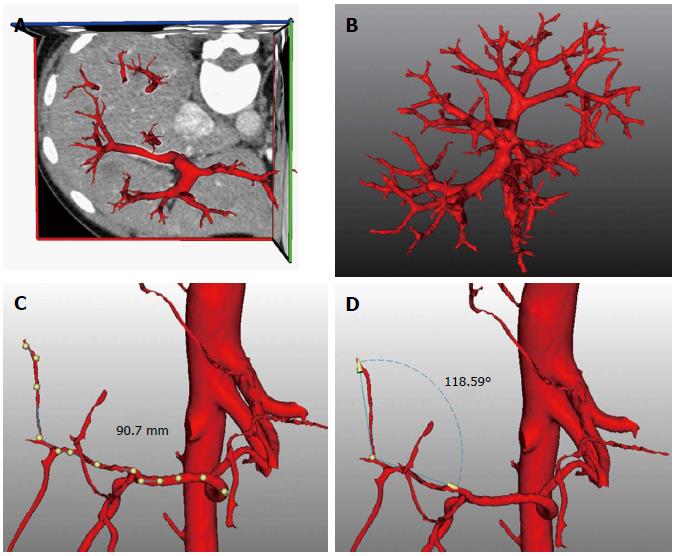
Figure 2 Vascular tree reconstruction.
Reconstruction was based on A: Computed tomography data; B: Patient’s individual vascular territories for different vessel stratifications were calculated, including C, D: Specified angle, diameter, and length.
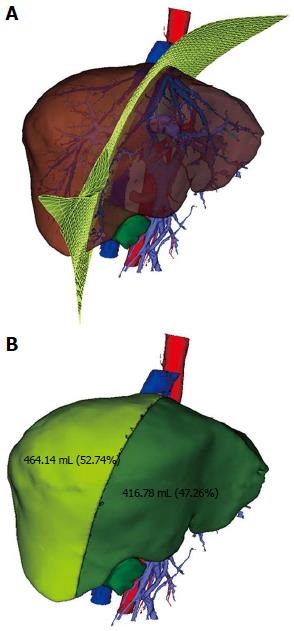
Figure 3 Virtual dissection plane.
A: The plane was adjusted in real time; B: The corresponding liver volume was automatically calculated.
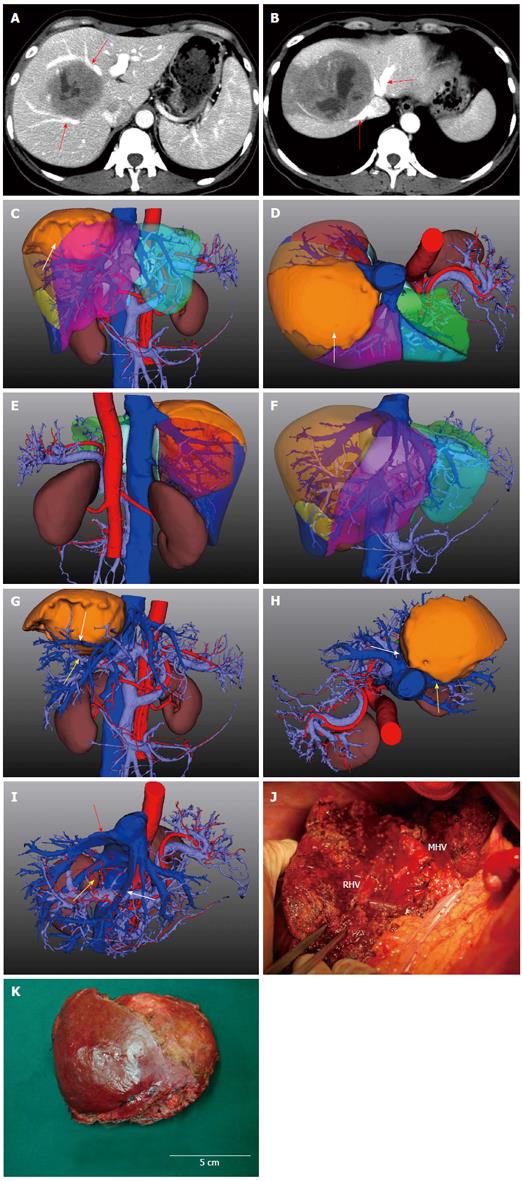
Figure 4 Digitized three-dimensional morphometric models.
A, B: Images obtained from a 48-year-old woman who underwent curative partial hepatic resection. Enhanced computed tomography (CT) images revealed a hypointense hepatocellular carcinoma nodule on delayed phase, measuring 8.5 cm in diameter, in segment VIII of the liver, the edges of which compressed the middle, right hepatic vein (RHV) and inferior vena cava (arrows); C-E: Integrated three-dimensional anterior, superior, and posterior view of the reconstructed model (tumor in yellow, white arrow); F: The eight Couinaud’s segments were demonstrated by different colors (tumor concealed); G: When eliminating the normal liver tissue, the relationship between the tumor nodule and adjacent pedicle structures was clearly demonstrated [the upper branch of the middle hepatic vein (MHV) is shown by the white arrow, the anterior branch of the right portal vein is shown by the yellow arrow]; H: The RHV (yellow arrow) and MHV (white arrow) were simulated consistent with the CT image; I: When the tumor mass was concealed, the compressive effect of the RHV (red arrow) and MHV (white arrow) was clearly demonstrated, the rims of the two main vascular branches were not eroded by the tumor tissue as the vascular wall was intact in the model. The nutritional pampiniform arteries of this huge tumor mass were also viewed (yellow arrow); J: Tumor resection surface showed the exposed surface of the RHV and MHV, the vascular wall of the two vessels was intact; K: The tumor specimen with intact encapsulation after resection.
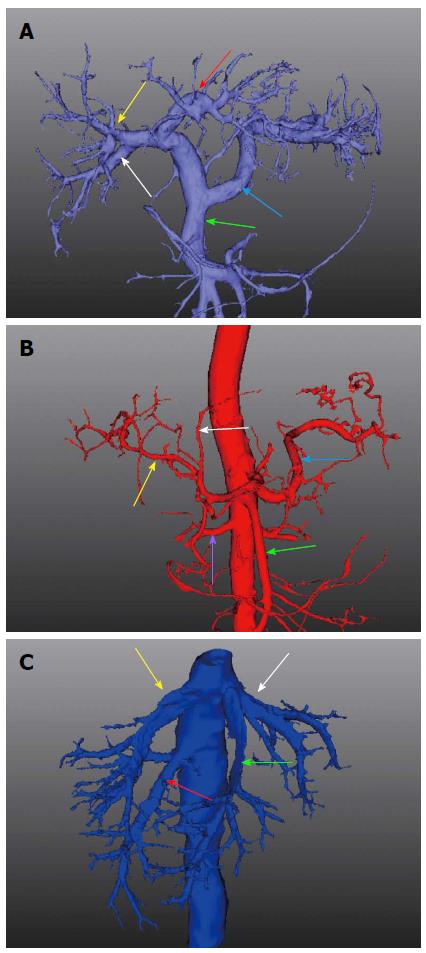
Figure 5 Three-dimensional images of the abdominal aorta system, portal vein system, and hepatic vein.
A: Three-dimensional (3D) image shows the portal vein system, which consists of the superior mesenteric vein (green arrow), splenic vein (blue arrow), left branch of the portal vein (red arrow), right anterior branch of the portal vein (yellow arrow), and right posterior branch of the portal vein (white arrow); B: 3D color-coded image of the abdominal aorta system: arteria hepatica propria including the left branch (white arrow) and right branch (yellow arrow), splenic artery (blue arrow), superior mesenteric artery (green arrow), and renal artery (purple arrow); C: Reconstruction of the outflow tract of the hepatic vein: left hepatic vein (white arrow), middle hepatic vein (green arrow), right hepatic vein (yellow arrow), and right posterior inferior hepatic vein (red arrow).
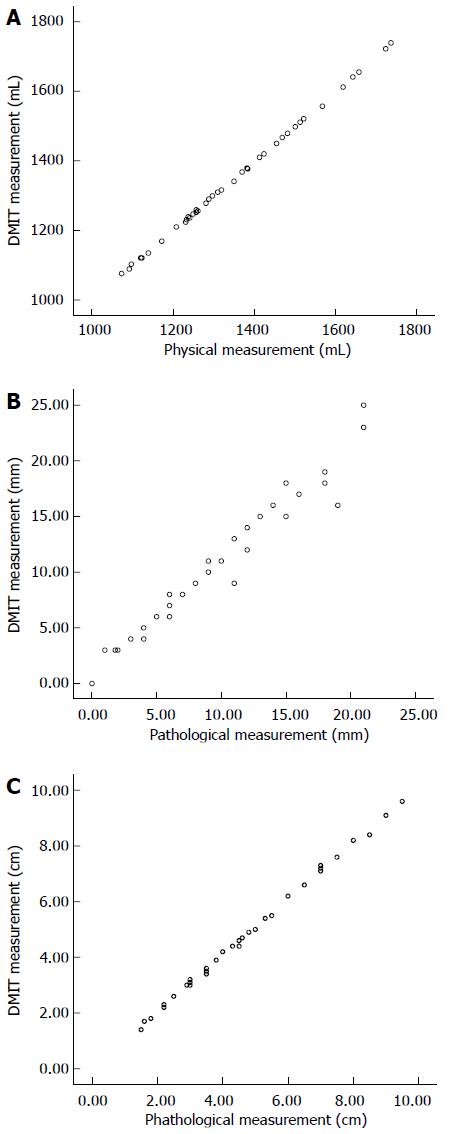
Figure 6 Volumetry measurement by the three-dimensional model.
A: Overall correlation between predicted whole liver volume by DMIT software and physical measurement by the mathematics specialist; B: Correlation between simulated and actual resection margin by pathologic identification; C: Correlation between predicted and actual maximum tumor diameter.
- Citation: Tian F, Wu JX, Rong WQ, Wang LM, Wu F, Yu WB, An SL, Liu FQ, Feng L, Bi C, Liu YH. Three-dimensional morphometric analysis for hepatectomy of centrally located hepatocellular carcinoma: A pilot study. World J Gastroenterol 2015; 21(15): 4607-4619
- URL: https://www.wjgnet.com/1007-9327/full/v21/i15/4607.htm
- DOI: https://dx.doi.org/10.3748/wjg.v21.i15.4607


