©The Author(s) 2015.
World J Gastroenterol. Apr 14, 2015; 21(14): 4334-4344
Published online Apr 14, 2015. doi: 10.3748/wjg.v21.i14.4334
Published online Apr 14, 2015. doi: 10.3748/wjg.v21.i14.4334
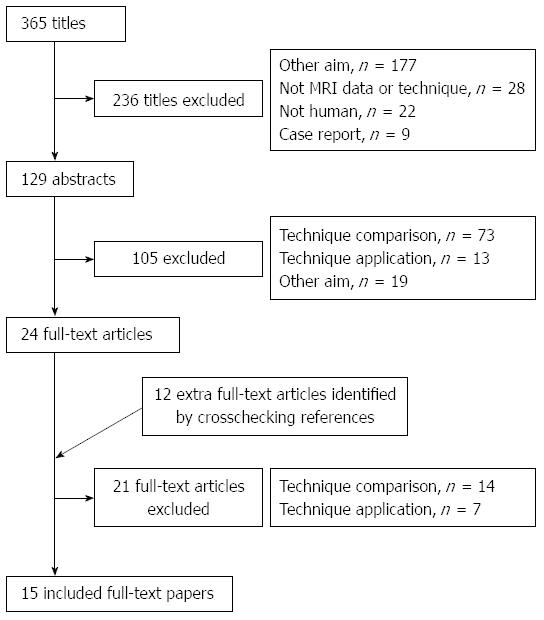
Figure 1 Flow chart of process used to select eligible articles.
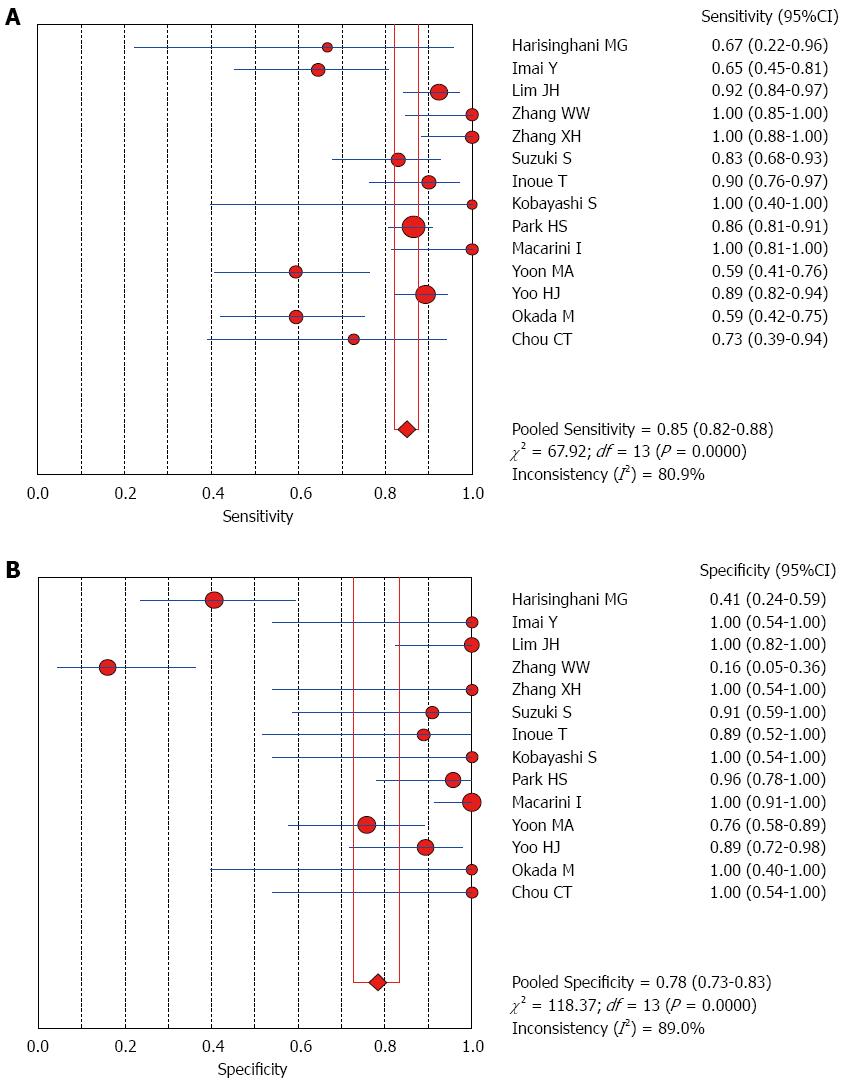
Figure 2 Forest plots for comparing hepatocellular carcinomas with all other liver lesions.
A: Sensitivity; B: Specificity of 14 studies.
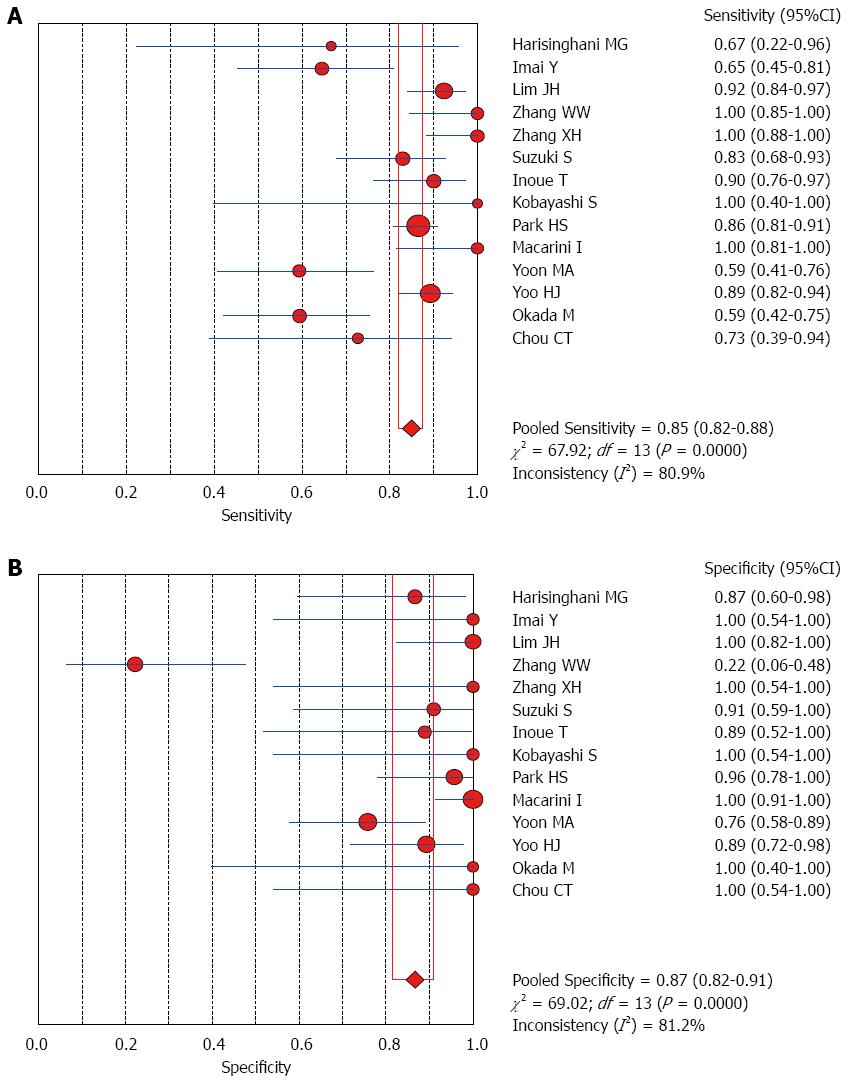
Figure 3 Forest plots for comparing hepatocellular carcinomas with benign liver lesions.
A: Sensitivity; B: Specificity of 14 studies.
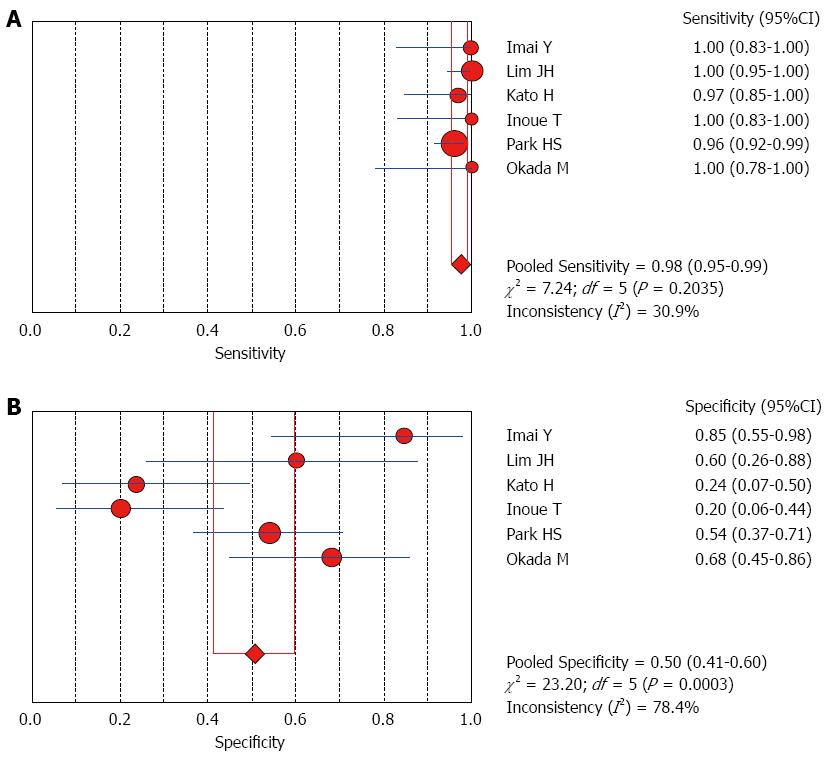
Figure 4 Forest plots for comparing advanced hepatocellular carcinomas with well-differentiated hepatocellular carcinomas.
A: Sensitivity; B: Specificity of seven studies.
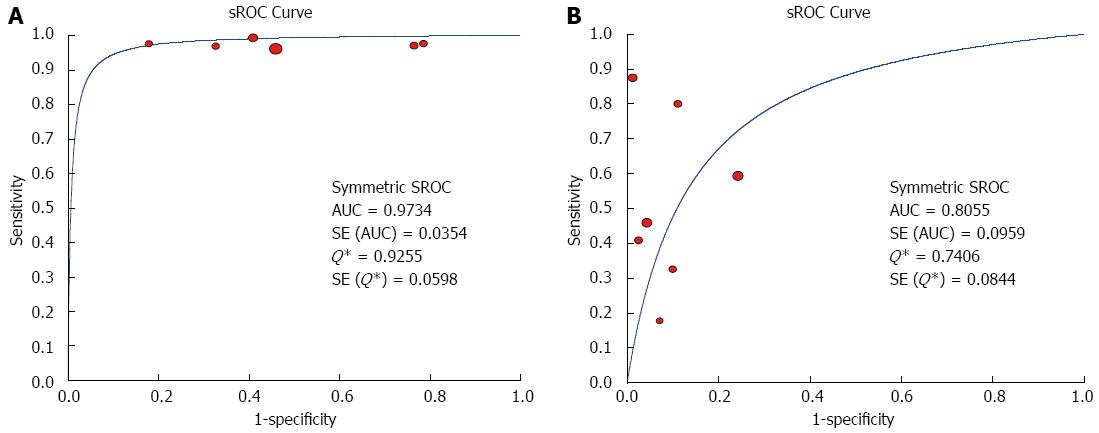
Figure 5 Summary receiver operating characteristics curves.
Sensitivity and specificity are plotted for studies comparing advanced hepatocellular carcinomas (HCCs) with well-differentiated HCCs (A) and well-differentiated HCCs with dysplastic nodules (B). AUC: Area under the curve; sROC: Summary receiver operating characteristics.
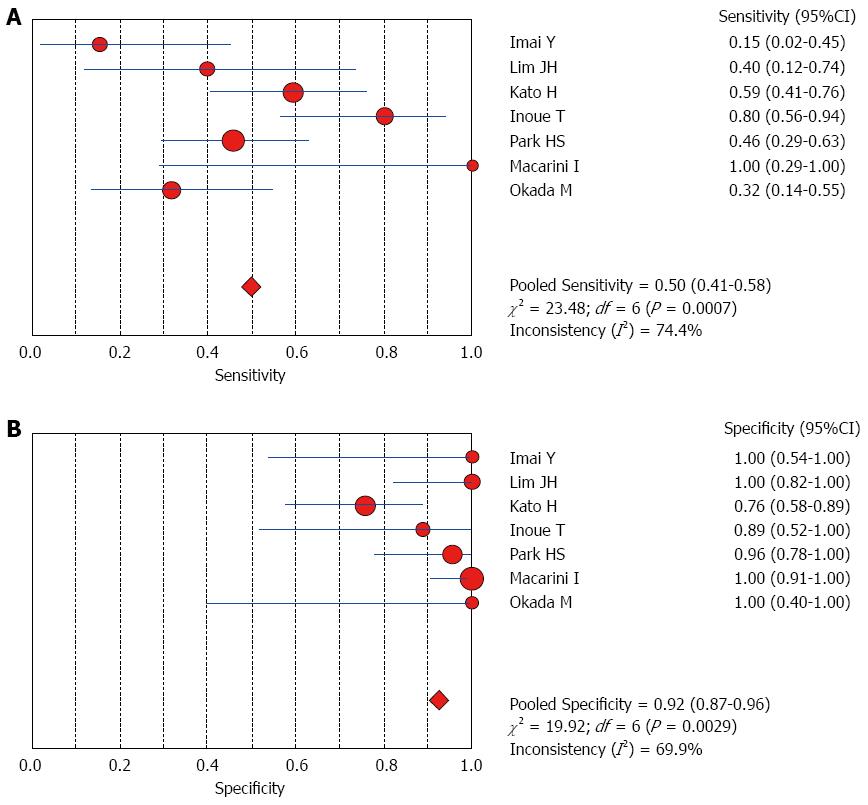
Figure 6 Forest plots for comparing well-differentiated hepatocellular carcinomas with dysplastic nodules.
A: Sensitivity; B: Specificity of seven studies.
- Citation: Li YW, Chen ZG, Wang JC, Zhang ZM. Superparamagnetic iron oxide-enhanced magnetic resonance imaging for focal hepatic lesions: Systematic review and meta-analysis. World J Gastroenterol 2015; 21(14): 4334-4344
- URL: https://www.wjgnet.com/1007-9327/full/v21/i14/4334.htm
- DOI: https://dx.doi.org/10.3748/wjg.v21.i14.4334


