Copyright
©The Author(s) 2015.
World J Gastroenterol. Apr 7, 2015; 21(13): 4006-4013
Published online Apr 7, 2015. doi: 10.3748/wjg.v21.i13.4006
Published online Apr 7, 2015. doi: 10.3748/wjg.v21.i13.4006
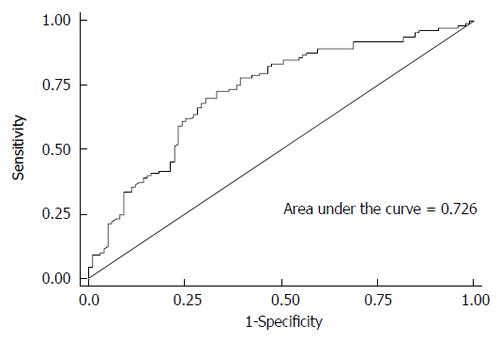
Figure 1 Prediction of rapid viral response.
Receiver-operating characteristic (ROC) curve for prediction of RVR using all significant variables. areas under the curve (AUC) was 0.726. RVR: Rapid viral response.
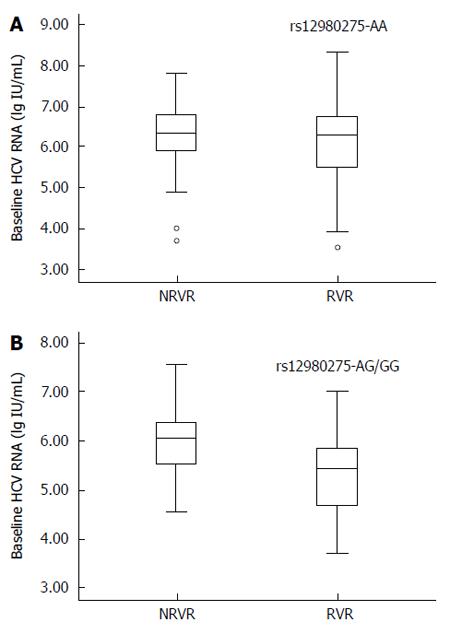
Figure 2 Stratified analysis of baseline hepatitis C virus-RNA viral load and rapid viral response.
A: Box plots of baseline hepatitis C virus (HCV)-RNA levels on RVR for rs12980275 AA group. Mean log HCV-RNA viral load was 6.28 ± 0.75 lg(copies/mL) and 6.10 ± 0.95 lg(copies/mL) for the non-RVR and RVR groups, respectively (t = 1.47, P = 0.143); B: Box plots for rs12980275 AG/GG group. Mean log HCV-RNA viral load was 5.97 ± 0.67 lg(copies/mL) and 5.37 ± 1.01 lg(copies/mL), respectively (t = 2.44, P = 0.018). The error bars indicate standard deviations. RVR: Rapid viral response.
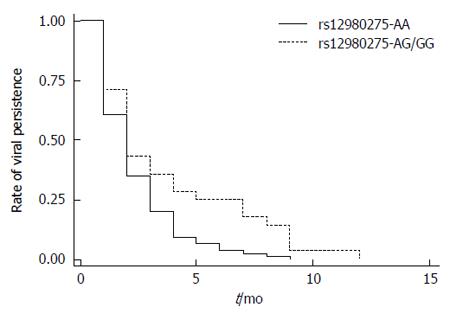
Figure 3 Kaplan-Meier plots of viral persistence rate by IL28B rs12980275 (log-rank P = 0.
0041).
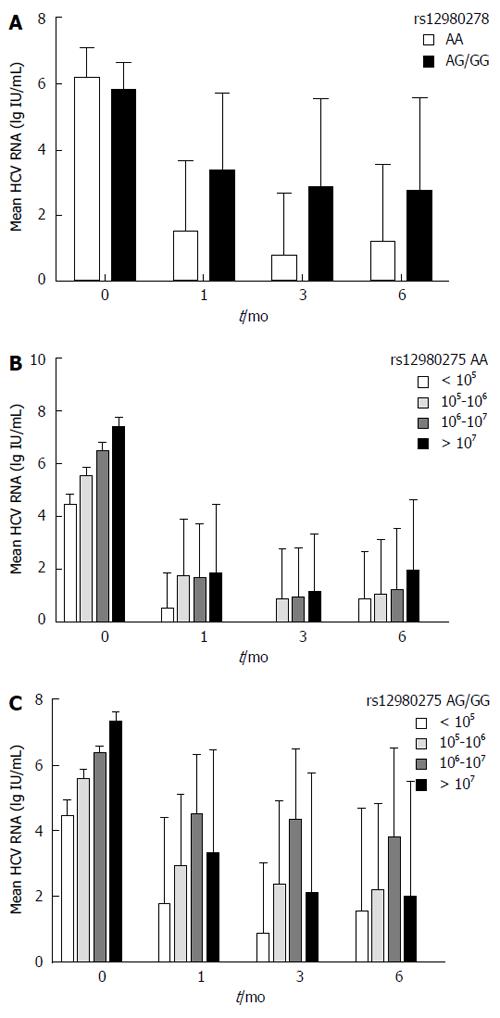
Figure 4 Viral kinetics during therapy.
Mean log hepatitis C virus (HCV)-RNA levels at baseline, 1 mo, 3 mo and 6 mo. A: Stratified by IL28B rs12980275 (AA vs AG/GG); B: Stratified by baseline HCV-RNA levels (< 105 IU/mL, 105-106 IU/mL, 106-107 IU/mL, ≥ 107 IU/mL) in rs12980275 AA group; C: Stratified by baseline HCV-RNA levels in rs12980275 AG/GG group.
- Citation: Zhang YY, Chen HB, Xu Y, Huang P, Wang J, Zhang Y, Yu RB, Su J. Interferon-λ-related genes and therapeutic response in Chinese hepatitis C patients. World J Gastroenterol 2015; 21(13): 4006-4013
- URL: https://www.wjgnet.com/1007-9327/full/v21/i13/4006.htm
- DOI: https://dx.doi.org/10.3748/wjg.v21.i13.4006


