Copyright
©The Author(s) 2015.
World J Gastroenterol. Apr 7, 2015; 21(13): 3893-3903
Published online Apr 7, 2015. doi: 10.3748/wjg.v21.i13.3893
Published online Apr 7, 2015. doi: 10.3748/wjg.v21.i13.3893
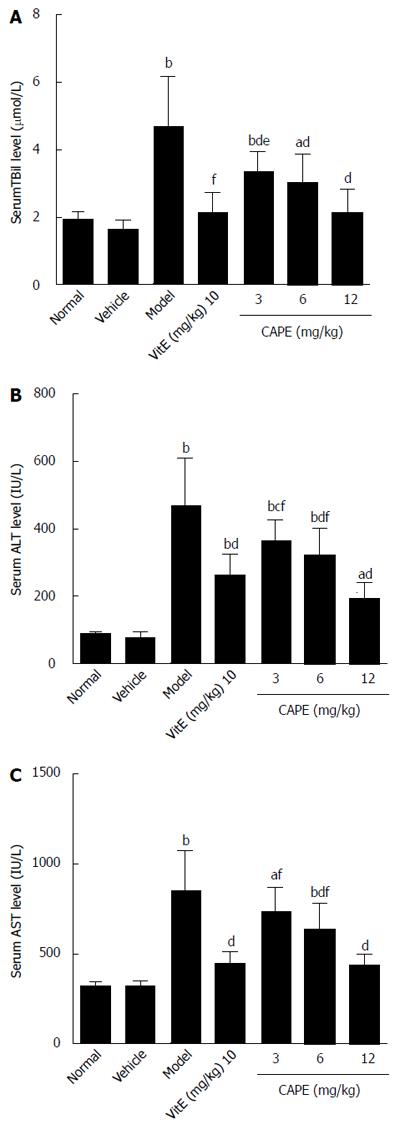
Figure 1 Effects of caffeic acid phenethyl ester on serum TBil (A), ALT (B), and AST (C) levels in rats.
Bars and error bars represent mean ± SD, t = 2.741-10.5, aP < 0.05, bP < 0.01 vs normal group, respectively; t = 2.9-7.371, cP < 0.05, dP < 0.01 vs model group, respectively; t = 3.225-5.229, eP < 0.05, fP < 0.01 vs CAPE (12 mg/kg) group, respectively. CAPE: Caffeic acid phenethyl ester; Vit E: Vitamin E.
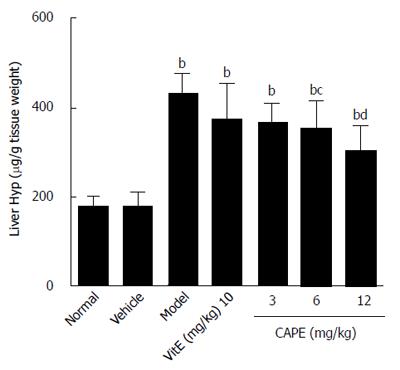
Figure 2 Liver hydroxyproline contents in the groups.
Bars and error bars represent mean ± SD. t = 4.959-10.38, bP < 0.01 vs normal group; t = 3.090-5.148, cP < 0.05, dP < 0.01 vs model group, respectively. CAPE: Caffeic acid phenethyl ester; Vit E: Vitamin E; Hyp: Hydroxyproline.
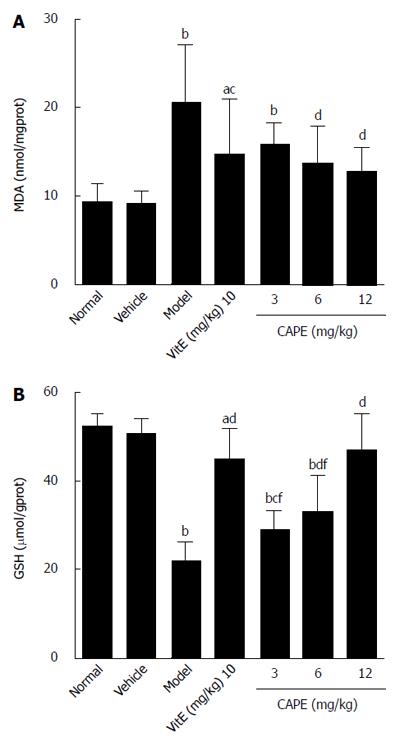
Figure 3 Tissue levels of malondialdehyde (A) and glutathione (B) in the groups.
Bars and error bars represent mean ± SD. t = 2.767-9.292, aP < 0.05, bP < 0.01 vs normal group, respectively; t = 2.721-9.551, cP < 0.05, dP < 0.01 vs normal group, respectively; t = 5.154-6.903, eP < 0.05, fP < 0.01 vs CAPE (12 mg/kg) group, respectively. CAPE: Caffeic acid phenethyl ester; Vit E: Vitamin E; MDA: Malondialdehyde; GSH: Glutathione.
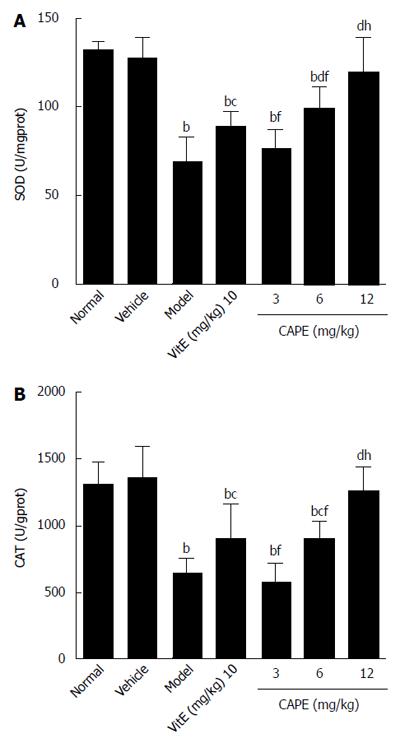
Figure 4 Superoxide dismutase and catalase activities in liver tissue.
Bars and error bars mean ± SD. t = 4.552-11.06, bP < 0.01 vs normal group; t = 2.876-8.689, cP < 0.05, dP < 0.01 vs model group, respectively; t = 3.393-7.503, fP < 0.01 vs CAPE (12 mg/kg) group, respectively; t = 3.969-4.997, gP < 0.05, hP < 0.01 vs vit E group, respectively. CAPE: Caffeic acid phenethyl ester; Vit E: Vitamin E; SOD: Superoxide; CAT: Catalase.
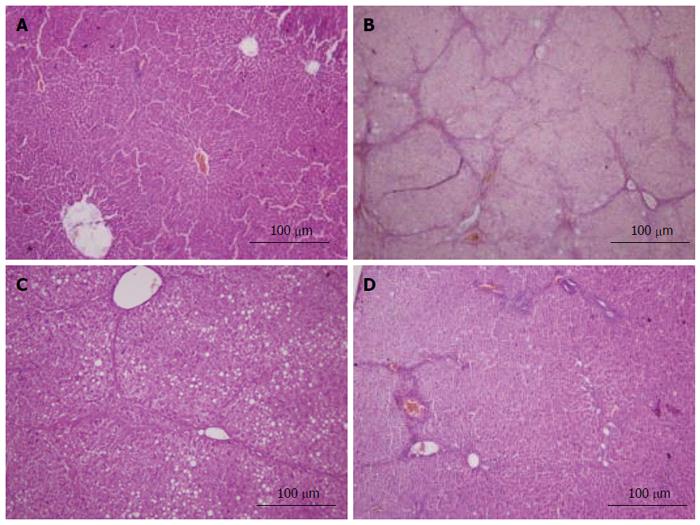
Figure 5 HE staining.
All sections were stained with hematoxylin and eosin (× 100). A: Liver sections of the normal group did not show histopathological changes; B: Liver sections of the model group showed liver tissue structural disorder, apoptotic cells, lymphocytic infiltration and typical pseudo-lobule; C: Liver sections of the vitamin E group showed steatosis, edema and swelling of hepatocytes, but no typical pseudo-lobule can be observed; D: Liver sections of the caffeic acid phenethyl ester (12 mg/kg) group showed spotty necrosis, steatosis, and blood sinusoids with mild congestion. The results of the other groups are not shown here.
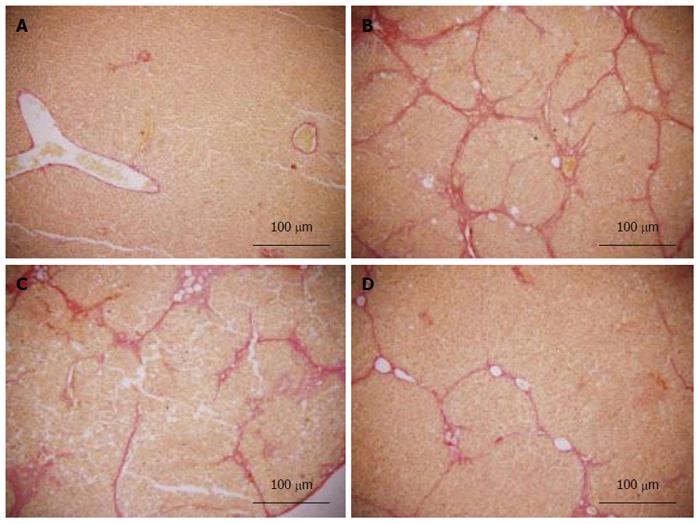
Figure 6 Van Gieson staining.
All sections were stained with van Gieson (× 100). A: Liver sections of the normal group did not show fibroplasia; B: Liver sections of the model group showed thick bundles of proliferous collagenous fibers stained with eosin and typical pseudo-lobule; C: Liver sections of the vitamin E group showed a small amount of collagenous fibers; D: Liver sections of the caffeic acid phenethyl ester (12 mg/kg) group showed a small amount of fibroplasia, which was less than that in the vitamin E group. The results of other groups are not shown here.
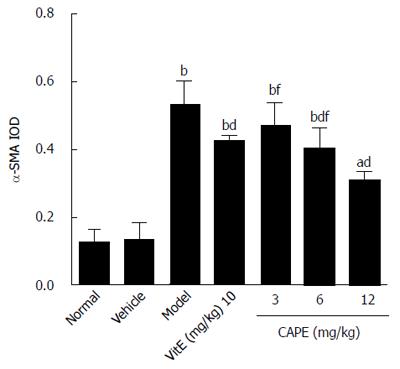
Figure 7 α-smooth muscle actin expression level in liver tissue.
Bars and error bars represent mean ± SD. t = 6.557-14.487, aP < 0.05, bP < 0.01 vs normal group, respectively; t = 3.784-7.913, cP < 0.05, dP < 0.01 vs model group, respectively; t = 3.284-5.718, fP < 0.01 vs CAPE (12 mg/kg) group, respectively; t = 4.129, gP < 0.05 vs vit E group, respectively. CAPE: Caffeic acid phenethyl ester; Vit E: Vitamin E; α-SMA: α-smooth muscle actin.
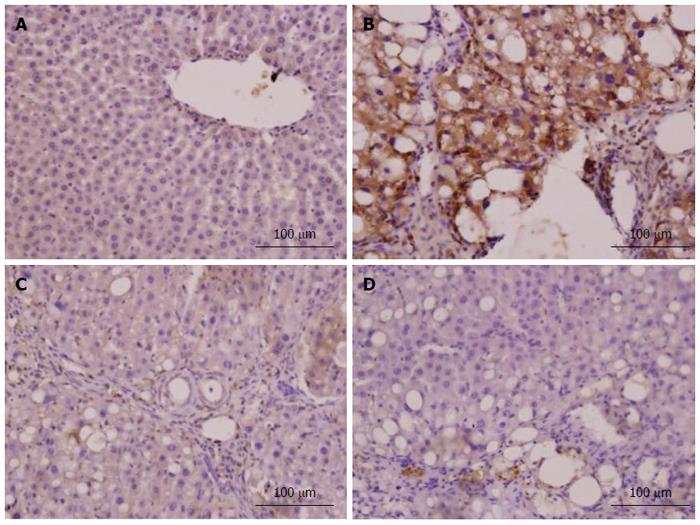
Figure 8 α-smooth muscle actin expression in liver tissue (immunohistochemistry, × 400).
The α-smooth muscle actin (α-SMA) expression level in liver tissue was confirmed by immunohistochemistry (× 400). A: Liver sections of the normal group showed a small amount of α-SMA-positive cells only present in vascular wall; B: Liver sections of the model group showed that the α-SMA protein was predominantly present in the fibrous septa, inflamed area and portal area; C: Liver sections of the vitamin E group showed that α-SMA-positive cells were distributed in fibroplasia and inflamed area, but the number of positive cells was less than that in the model group; D: Liver sections of the CAPE (12 mg/kg) group showed that α-SMA-positive cells were sparse, located in inflamed area. The results of the other groups are not shown here.
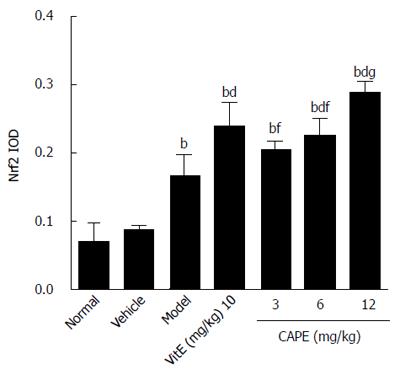
Figure 9 NF-E2-related factor 2 expression level in liver tissue.
Bars and error bars represent mean ± SD. t = 6.412-14.54, aP < 0.05, bP < 0.01 vs normal group, respectively; t = 3.936-8.126, cP < 0.05, dP < 0.01 vs model group, respectively; t = 4.190-5.627, eP < 0.05, fP < 0.01 vs CAPE (12 mg/kg) group, respectively; t = 3.252, gP < 0.05 vs vit E group, respectively. CAPE: Caffeic acid phenethyl ester; Vit E: Vitamin E; Nrf2: NF-E2-related factor 2.
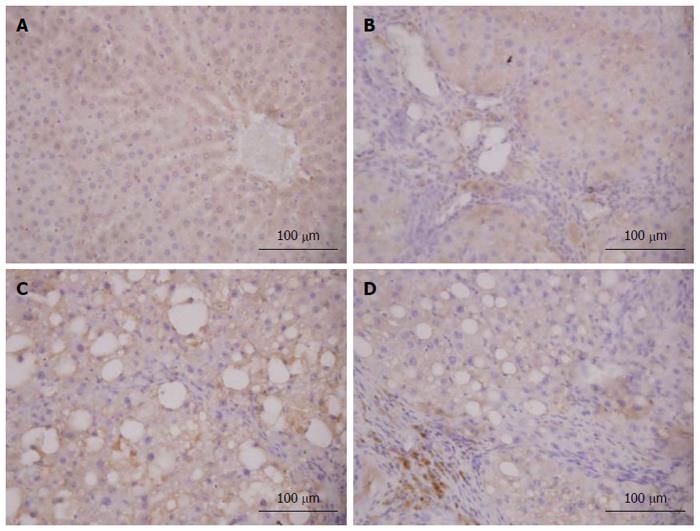
Figure 10 NF-E2-related factor 2 expression in liver tissue (immunohistochemistry).
The NF-E2-related factor 2 (Nrf2) expression in liver tissue was confirmed by immunohistochemistry (× 400). A: Liver sections of the normal group showed a small amount of Nrf2-positive cells only present in the cytoplasm; B: Liver sections of the model group showed only a few Nrf2-positive cells present in the fibrous septa and inflamed area; C: Liver sections of the vitamin E group showed that Nrf2-positive cells were distributed in fibroplasia and inflamed area, but the number of positive cells was more than that in the model group; D: Liver sections of the caffeic acid phenethyl ester (12 mg/kg) group showed that Nrf2-positive cells were located mainly in fibrosis and inflamed area and were strongly stained. The results of the other groups are not shown here.
- Citation: Li M, Wang XF, Shi JJ, Li YP, Yang N, Zhai S, Dang SS. Caffeic acid phenethyl ester inhibits liver fibrosis in rats. World J Gastroenterol 2015; 21(13): 3893-3903
- URL: https://www.wjgnet.com/1007-9327/full/v21/i13/3893.htm
- DOI: https://dx.doi.org/10.3748/wjg.v21.i13.3893


