Copyright
©The Author(s) 2015.
World J Gastroenterol. Mar 14, 2015; 21(10): 2949-2958
Published online Mar 14, 2015. doi: 10.3748/wjg.v21.i10.2949
Published online Mar 14, 2015. doi: 10.3748/wjg.v21.i10.2949
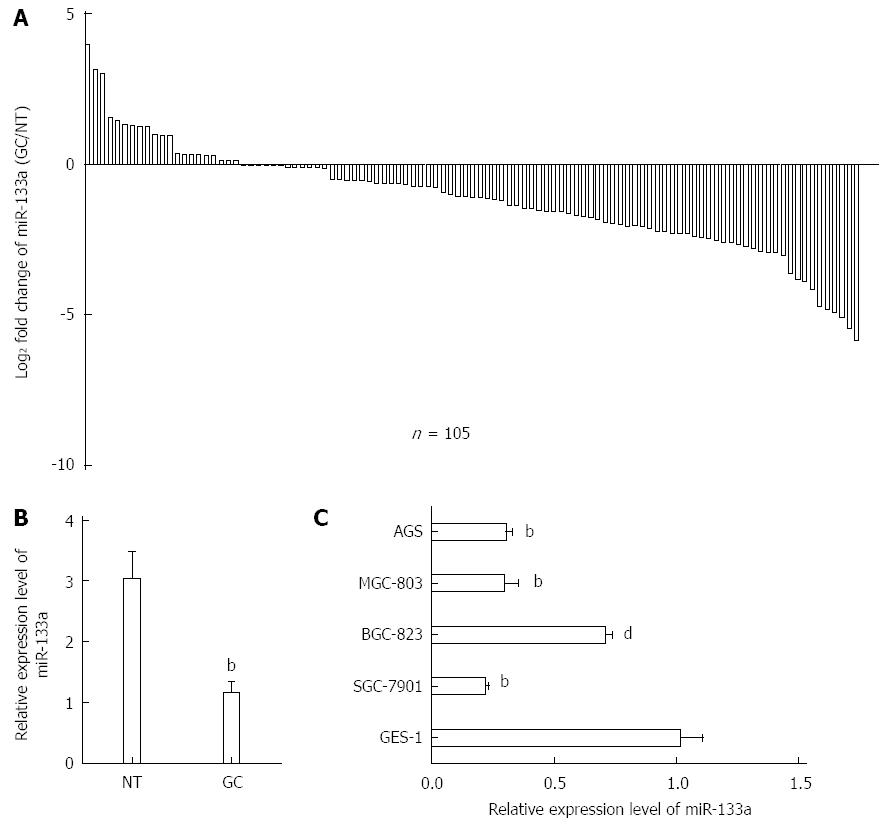
Figure 1 Decreased expression levels of miR-133a in gastric cancer tissues and cell lines.
A: Expression level of miR-133a in 105 pairs of gastric cancer (GC) tissue samples (tumor) and matched adjacent non-tumor tissue samples (normal) was analyzed using real-time quantitative reverse transcriptase polymerase chain reaction (qRT-PCR). U6 snRNA was used as an endogenous control. miR-133a expression was reduced in 80% of the paired tumor samples; B: Expression levels of miR-133a were drastically downregulated in GC tissues compared with the matched adjacent non-tumor tissues (bP < 0.01 vs non-tumor tissues); C: Relative expression of miR-133a in four GC cell lines and a normal gastric cell line (GES-1). qRT-PCR results represent the mean ± SEM of three independent experiments (dP < 0.01, bP < 0.01 vs GES-1).
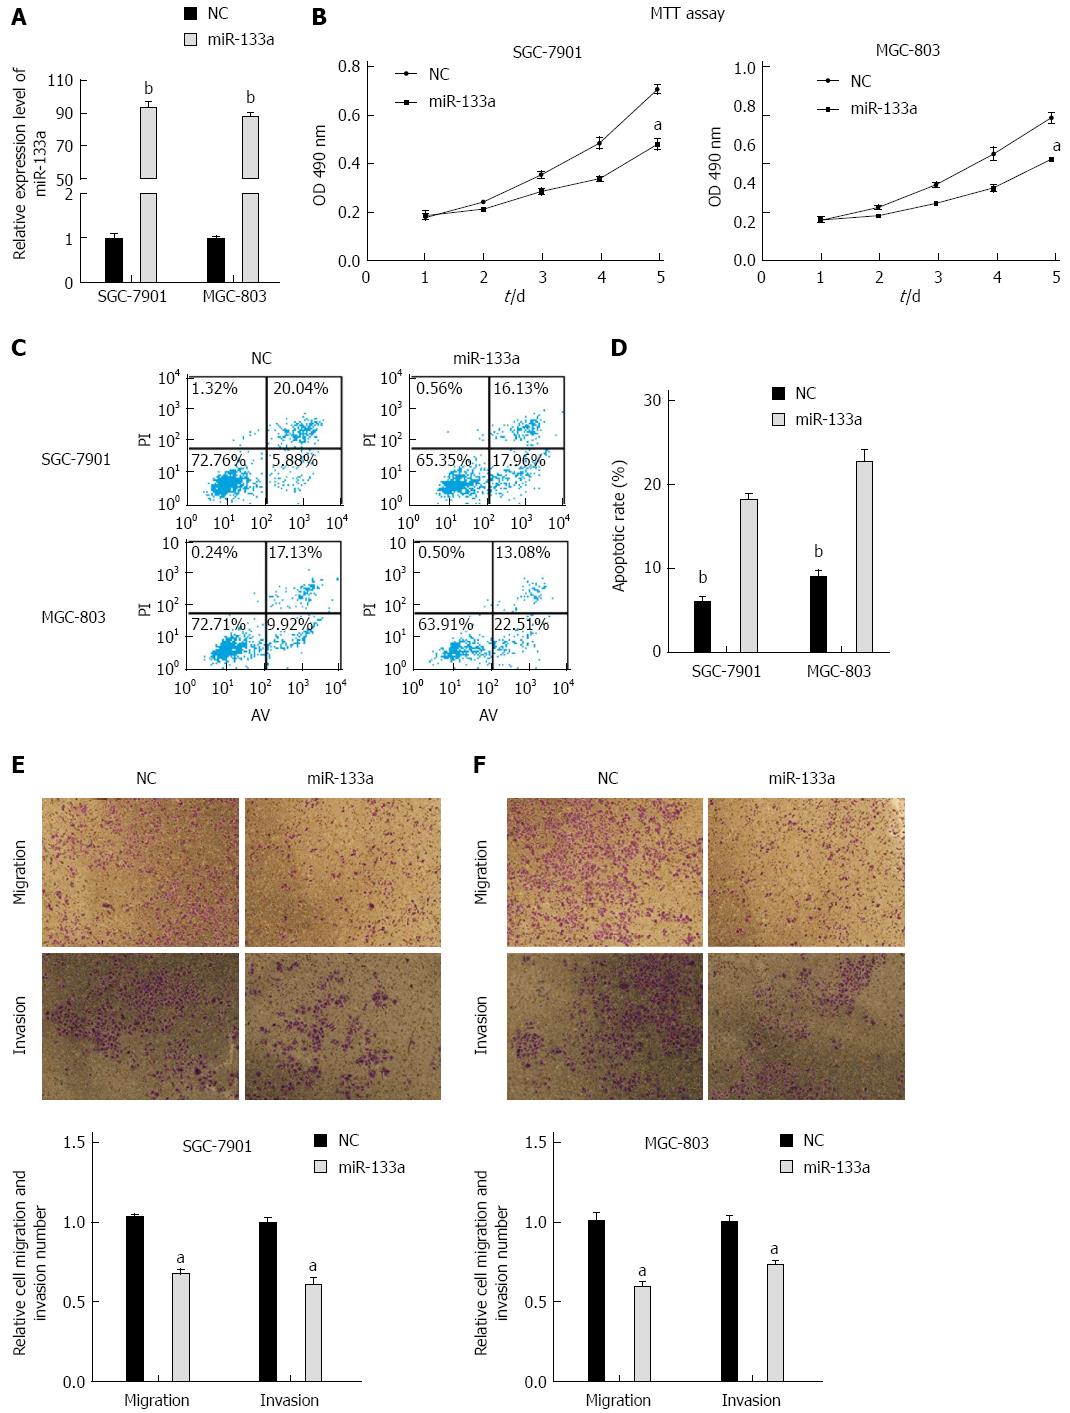
Figure 2 miR-133a inhibits proliferation, migration, and invasion and induces apoptosis in SGC-7901 and MGC-803 cells.
A: Total levels of miR-133a in SGC-7901 and MGC-803 cells transfected with synthetic miR-133a mimics or negative control mimics (bP < 0.01 vs negative control); B: Cell proliferation was analyzed using MTT assays in the SGC-7901 and MGC-803 cell lines. The assays were read every 24 h for five consecutive days following 24 h transfection (aP < 0.01 vs negative control); C: Cells that stained positive for FITC-Annexin V and negative for PI at 48 h post-transfection were scored as exhibiting early apoptosis; D: Statistical analysis of apoptotic cells (bP < 0.01 vs miR-133a); E and F: miR-133a mimics inhibit the migration and invasion of SGC-7901 and MGC-803 cells compared with negative control (aP < 0.01 vs negative control). All results represent the means ± SEM of three independent experiments.
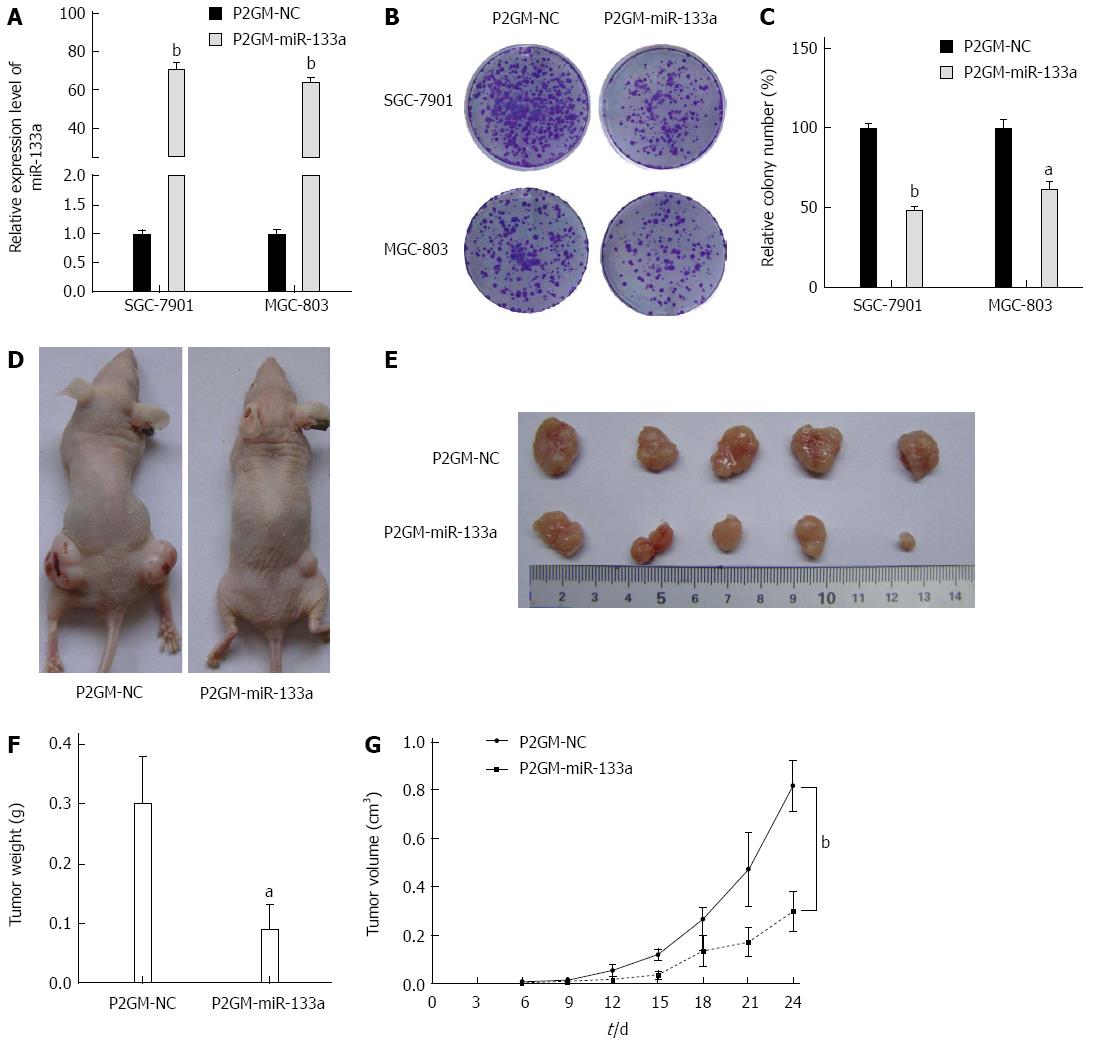
Figure 3 miR-133a represses the growth of gastric cancer cells in vivo.
A: Expression level of miR-133a in stable P2GM-miR-133a cells and empty vector-carrying control stable cells (bP < 0.01 vs control); B: Stable cells (1000) carrying either P2GM-miR-133a or an empty vector were plated onto six-well plates, and a colony formation assay was carried out; C: Quantitative analysis of colony numbers (aP < 0.05, bP < 0.01 vs control); D: Stable SGC-7901 cells carrying either P2GM-miR-133a or an empty vector were inoculated subcutaneously into the flanks of nude mice (n = 5 per group); E: Representative graphs of tumor masses harvested from nude mice 24 d after inoculation are shown; F: Tumor weight (aP < 0.05 vs control); G: Growth curves of the tumor volume (bP < 0.01 vs control). The average tumor weight is indicated as the mean ± SEM.
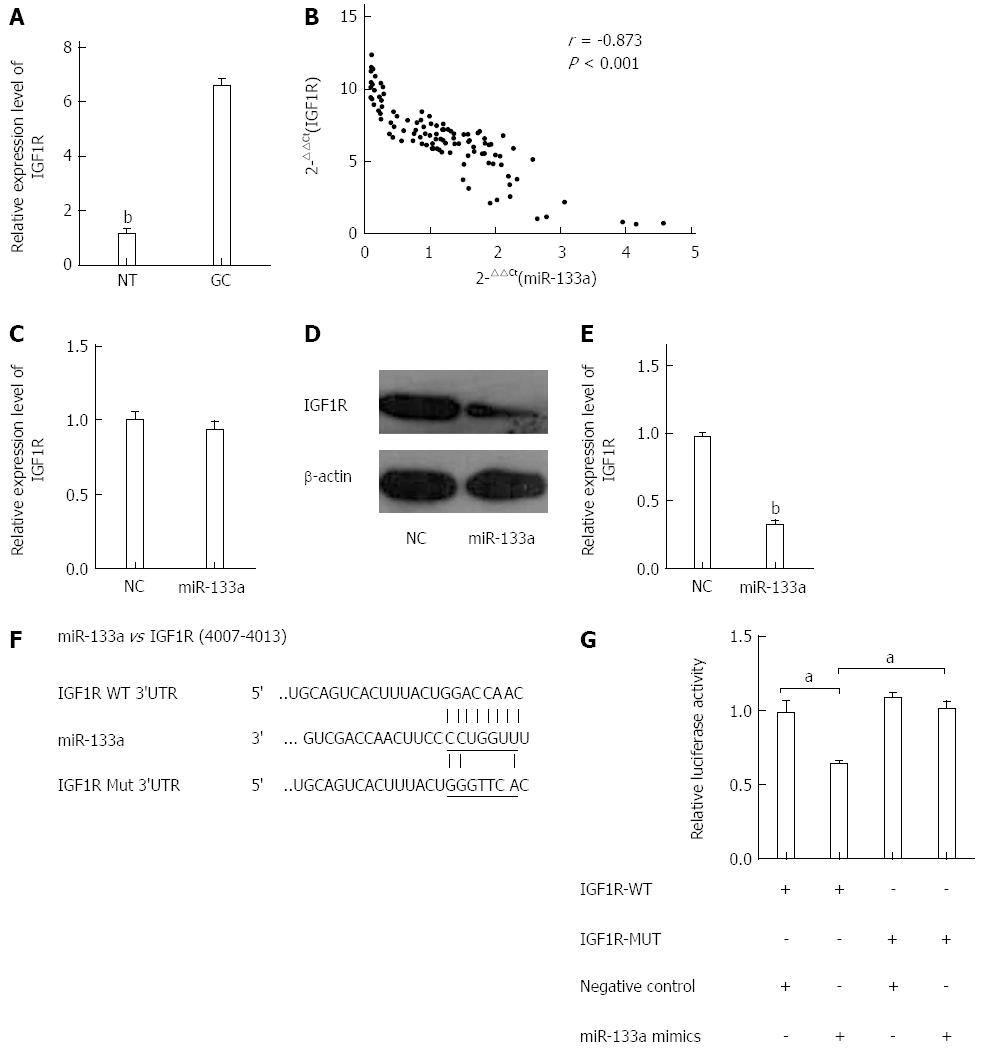
Figure 4 Insulin-like growth factor 1 receptor is a direct target of miR-133a.
A: Level of insulin-like growth factor 1 receptor (IGF1R) mRNA was analyzed in GC tissues using quantitative reverse transcriptase polymerase chain (qRT-PCR). The data are shown as fold change in tumor tissues relative to normal tissues (bP < 0.01 vs GC tissues); B: Expression levels of miR-133a and IGF1R were inversely correlated. The 2-ΔΔCt values of miR-133a and IGF1R mRNA were subjected to a Pearson correlation analysis (r = -0.873, P < 0.001, Pearson’s correlation); C: Level of IGF1R mRNA was examined using qRT-PCR in SGC-7901 cells 48 h after transfection with either miR-133a or negative control mimics; D: Level of IGF1R protein was examined using western blotting 48 h after transfection with miR-133a or negative control mimics; E: Relative intensity of IGF1R protein expression after normalization to β-actin (bP < 0.01 vs control); both D and E indicate that the level of IGF1R protein was significantly reduced compared with that of the negative control; F: Interaction between miR-133a and 3’ UTR of IGF1R was predicted using TargetScan. Here, “IGF1R Mut 3’UTR” indicates the IGF1R 3’ UTR with a mutation in the miR-133a binding site; G: Luciferase activity of a reporter containing a wild-type IGF1R 3’ UTR or a mutant IGF1R 3’ UTR are shown in the bar graph (aP < 0.05 vs control). All data are presented as the mean ± SEM of three independent experiments.
- Citation: Gong Y, Ren J, Liu K, Tang LM. Tumor suppressor role of miR-133a in gastric cancer by repressing IGF1R. World J Gastroenterol 2015; 21(10): 2949-2958
- URL: https://www.wjgnet.com/1007-9327/full/v21/i10/2949.htm
- DOI: https://dx.doi.org/10.3748/wjg.v21.i10.2949


