©The Author(s) 2015.
World J Gastroenterol. Jan 7, 2015; 21(1): 164-176
Published online Jan 7, 2015. doi: 10.3748/wjg.v21.i1.164
Published online Jan 7, 2015. doi: 10.3748/wjg.v21.i1.164
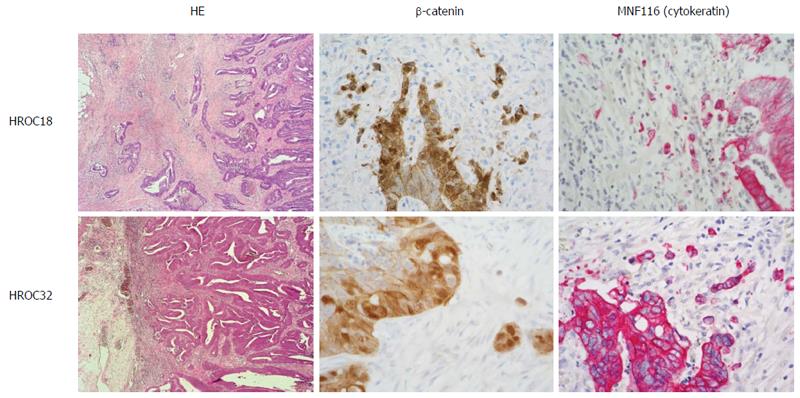
Figure 1 Representative histology of original patients’ tumors HROC18 and HROC32.
HE histology, β-catenin, and cytokeratin (MNF116) staining as described in material and methods. Original magnification × 40.
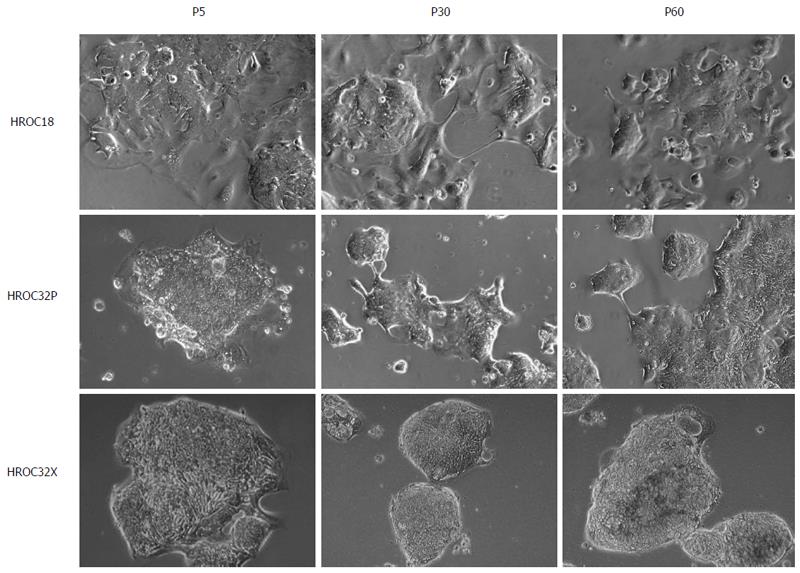
Figure 2 Light microscopy of tumor cell lines after direct establishment (P5), and following short- (P30) and long-term in vitro culture (P60).
Cell lines were established directly from patients’ tumor material and following xenografting in murine recipients as described in material and methods. Original magnification × 100.
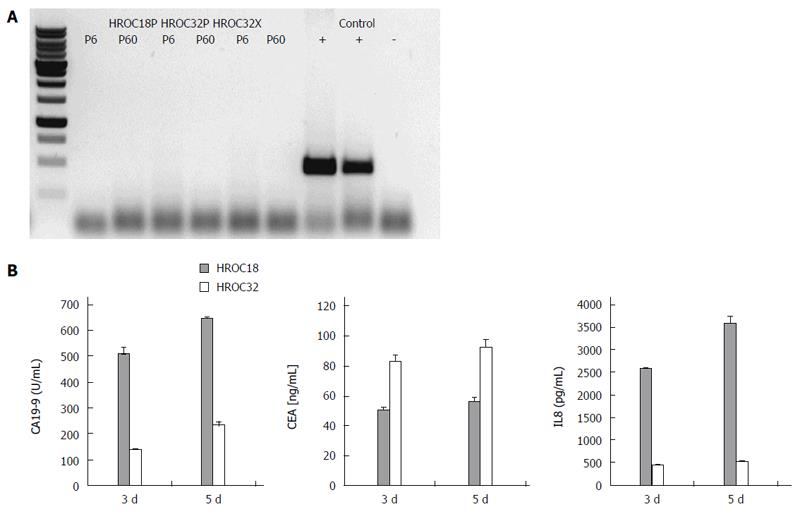
Figure 3 Mycoplasma polymerase chain reaction, ploidy status, and secretion profile of tumor cells.
A: Displayed are the results for 16S-rRNA-gene-based polymerase chain reaction for mycoplasma. All three lines were found free of contaminating mycoplasma. Samples amplified in the absence of tumor DNA served as a negative control, whereas a highly contaminated cell line was applied as a positive control, run in duplicates; B: Cytokine secretion pattern as determined by enzyme-linked immunosorbent assays. Cytokine concentrations were determined by comparison with a standard curve generated from serial dilutions of individual standards. Quantitative analysis of carcinoembryonic antigen (CEA), carbohydrate antigen 19-9 (CA19-9), and interleukin (IL) 8 secretion after three and five days of culture, respectively. Results show the mean ± SD of three independent experiments.
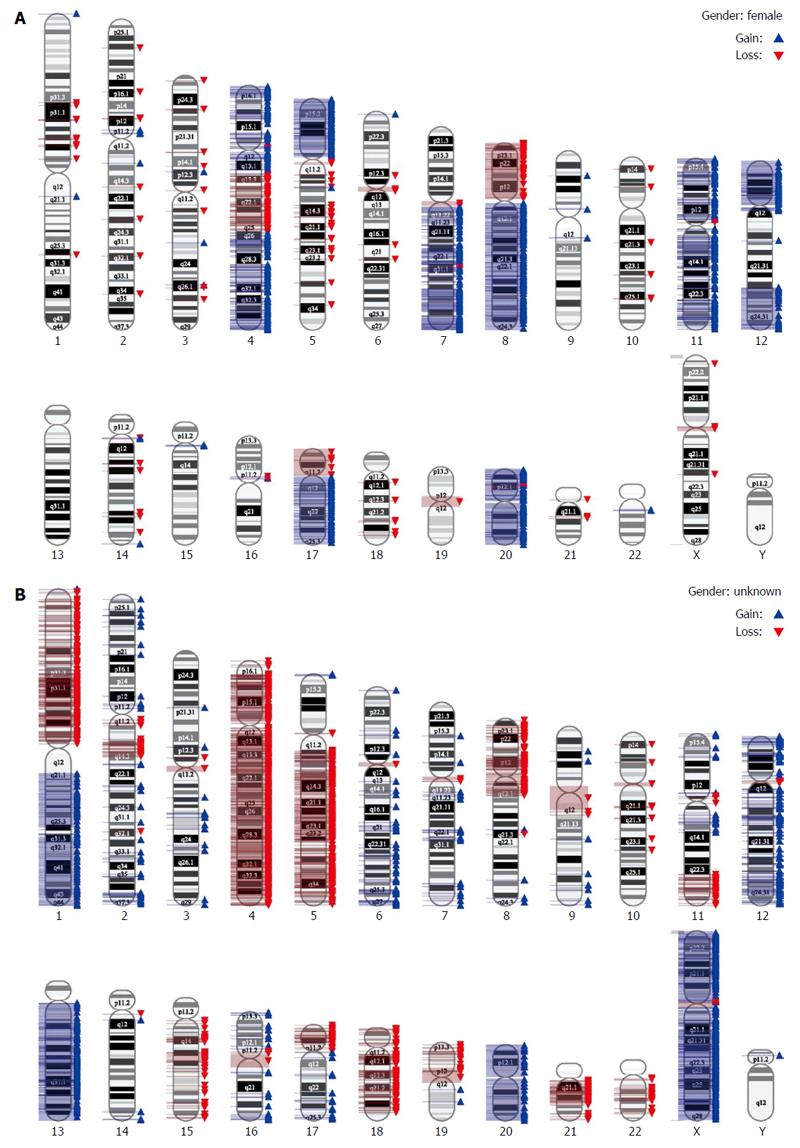
Figure 4 Single nucleotide polymorphism array 6.
0 for assessment of chromosomal instability in cell lines. Analysis was performed according to manufacturer’s instructions. A: HROC18 cells; B: HROC32P cells.
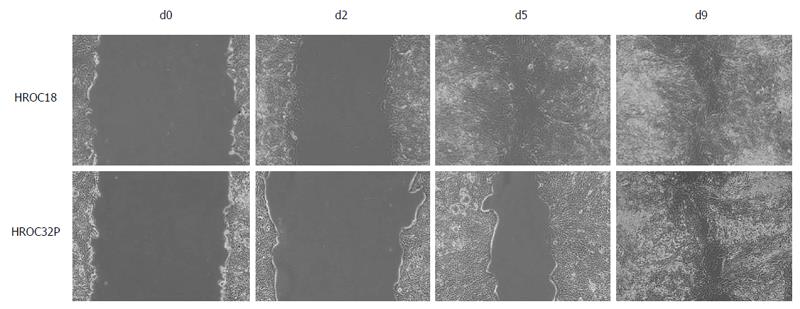
Figure 5 Wound healing assays were performed with HROC18 and HROC32P cells, respectively.
Representative images of migrating tumor cells around the wound area at d0, d2, d5, and d9 after wounding are shown. d: Day.
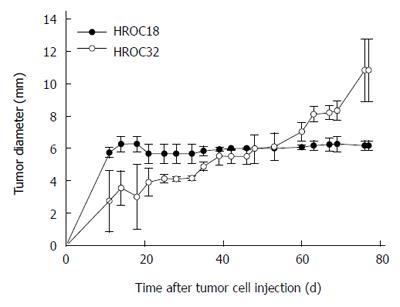
Figure 6 In vivo tumorigenicity.
Female NMRI Foxn1nu mice were challenged subcutaneously with 5 × 10⁶ tumor cells. Monitoring of tumor growth was performed for a total of 80 d. Both cell lines exhibited low tumorigenic potential in vivo, as can be depicted from the tumor growth curve. Values are given as mean tumor diameter ± SD.
- Citation: Maletzki C, Gock M, Randow M, Klar E, Huehns M, Prall F, Linnebacher M. Establishment and characterization of cell lines from chromosomal instable colorectal cancer. World J Gastroenterol 2015; 21(1): 164-176
- URL: https://www.wjgnet.com/1007-9327/full/v21/i1/164.htm
- DOI: https://dx.doi.org/10.3748/wjg.v21.i1.164


