©2014 Baishideng Publishing Group Inc.
World J Gastroenterol. Dec 28, 2014; 20(48): 18445-18451
Published online Dec 28, 2014. doi: 10.3748/wjg.v20.i48.18445
Published online Dec 28, 2014. doi: 10.3748/wjg.v20.i48.18445
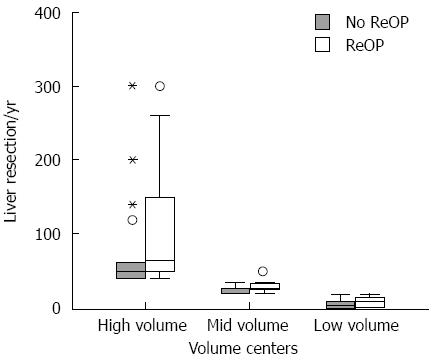
Figure 1 Box plots of the annual volume of liver resections, separated according to volume strata and occurrence of re-resection (T2-3 carcinomas).
The middle bar of the box plot represents the median, while the lower and upper bars of the box represent the 25th and 75th quartiles, respectively. The dots and asterisks represent outliers.
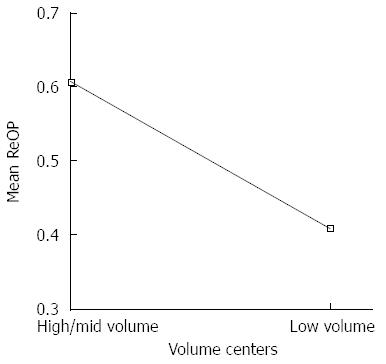
Figure 2 ANOVA of high/mid-volume vs low-volume centers according to the mean rate of liver resection.
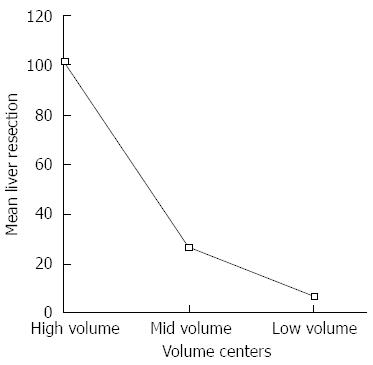
Figure 3 Mean rate of liver resection in the 3 volume groups including all patients/all volume centers.
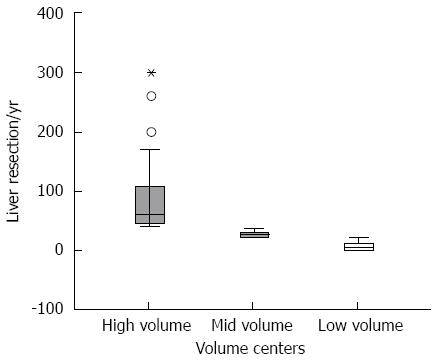
Figure 4 Medians of liver resections according to the 3 volume groups (Tis-T4 carcinomas/all patients).
The middle bar of the box plot represents the median, whereas the lower and upper bars of the box represent the 25th and 75th quartiles, respectively. The dots and asterisks represent outliers. The boxplot-test of all patients/volume-centers shows that the median of liver resection at high-volume centers was 60, that at mid-volume centers was 28 and that at low-volume centers was 5.
- Citation: Goetze TO, Paolucci V. Influence of high- and low-volume liver surgery in gallbladder carcinoma. World J Gastroenterol 2014; 20(48): 18445-18451
- URL: https://www.wjgnet.com/1007-9327/full/v20/i48/18445.htm
- DOI: https://dx.doi.org/10.3748/wjg.v20.i48.18445


