©2014 Baishideng Publishing Group Inc.
World J Gastroenterol. Dec 28, 2014; 20(48): 18375-18383
Published online Dec 28, 2014. doi: 10.3748/wjg.v20.i48.18375
Published online Dec 28, 2014. doi: 10.3748/wjg.v20.i48.18375
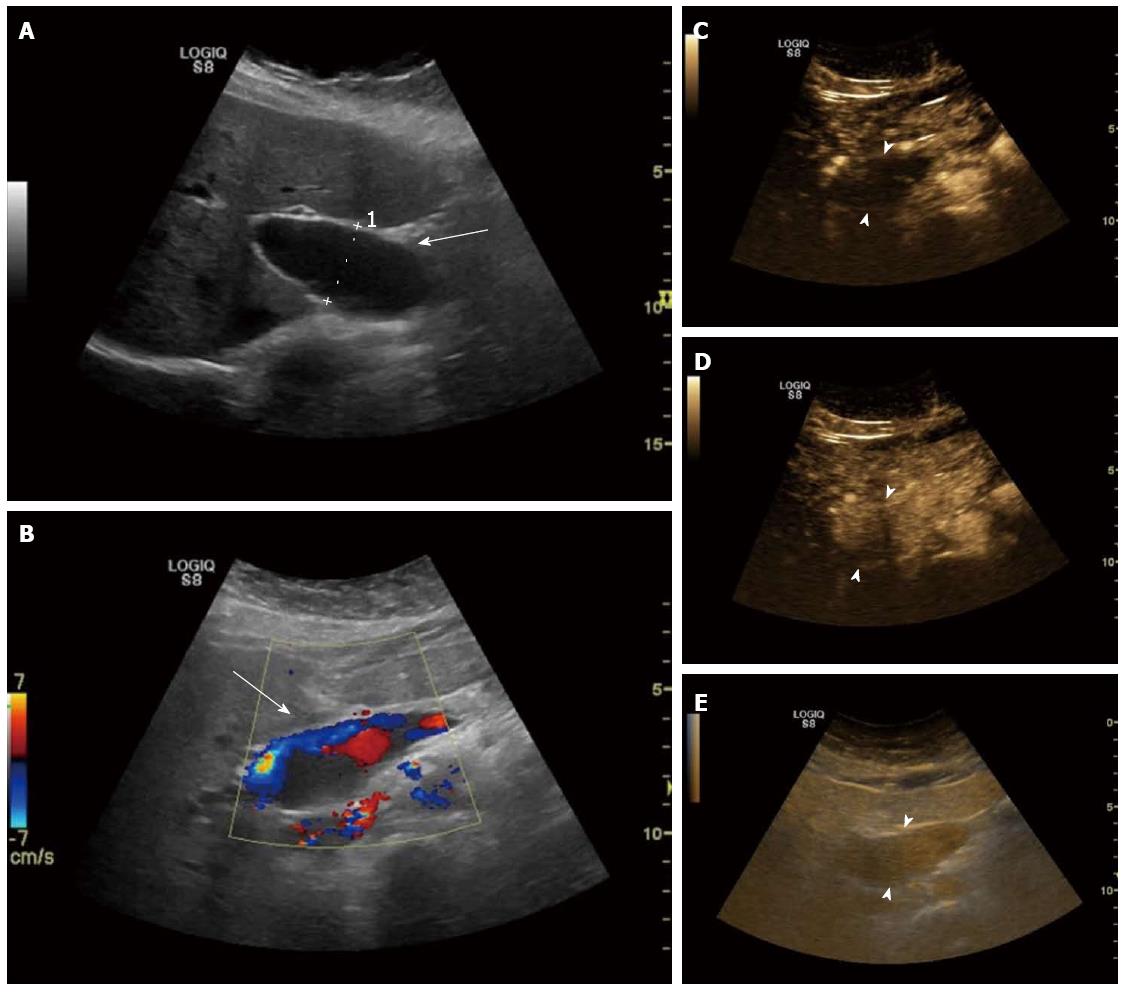
Figure 1 Patient 1: Portal venous system aneurysm in a 56-year-old woman with a history of overweight and dyslipidemia, who was referred because of suspected nonalcoholic fatty liver disease.
A: Right oblique sagittal view shows a focal fusiform dilatation of the extrahepatic segment of the main portal vein (arrow), with a maximum diameter of 30 mm (caliper 1); B: Right oblique sagittal view with color Doppler shows “to-and-fro” flow signal inside the lesion (arrow); C: Right oblique sagittal view shows the contrast-enhanced ultrasound characteristics of the portal venous system aneurysm which is not enhanced in the arterial phase (17 s, arrowheads); D: Homogenously enhanced throughout the early portal venous phase (22 s, arrowheads); E: Persistently enhanced with slow washout in the late phase (301 s, arrowheads).
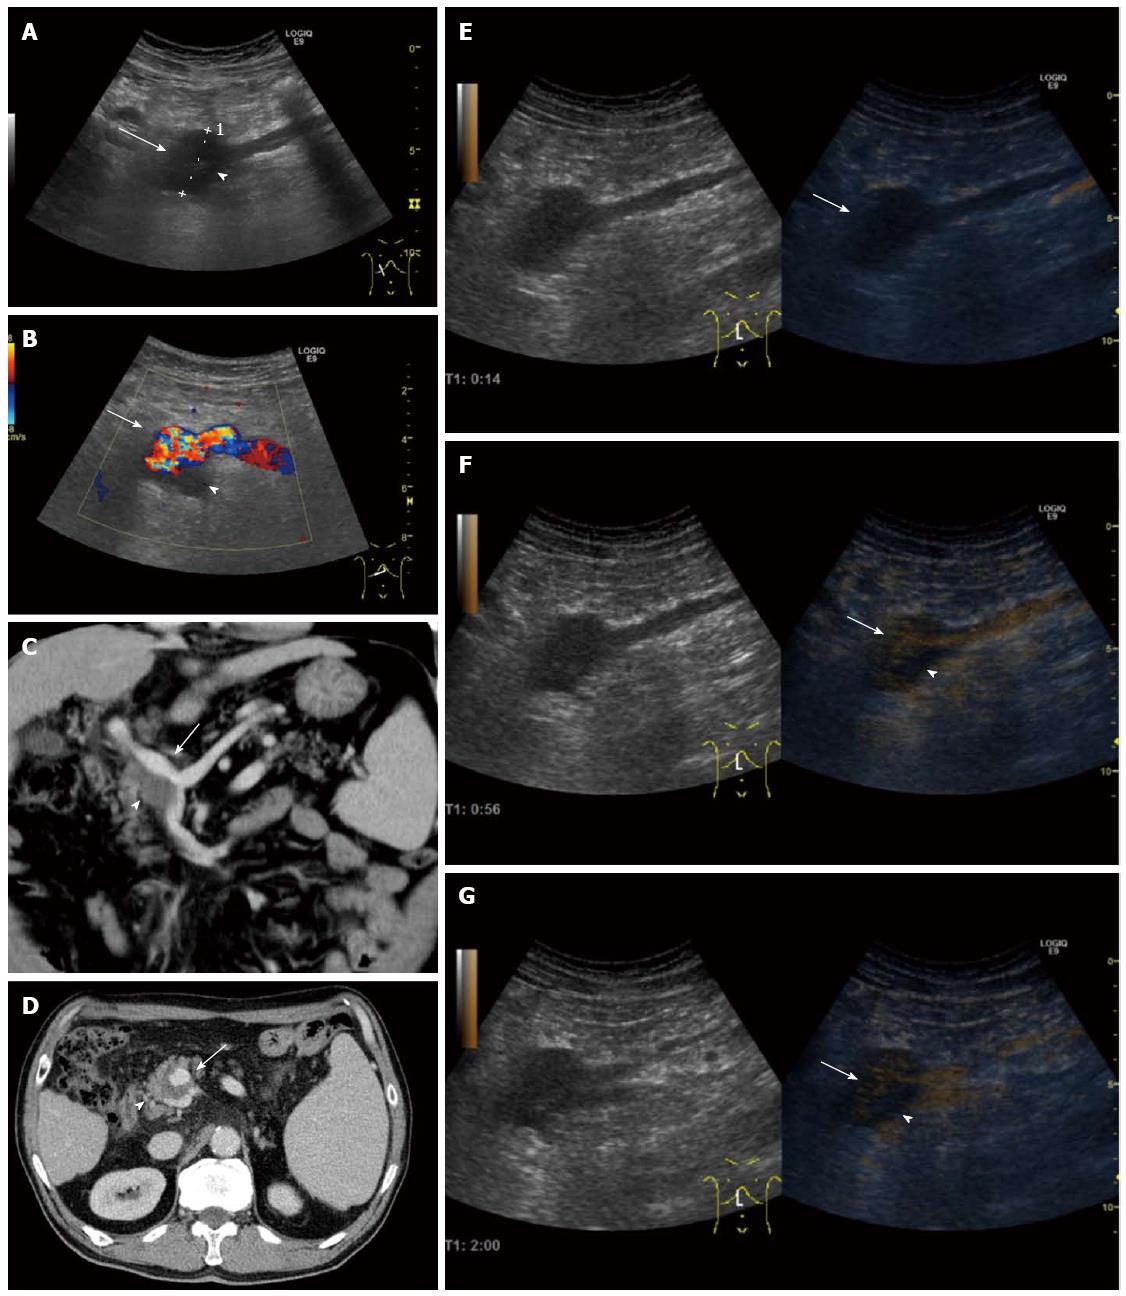
Figure 2 Patient 2: Portal venous system aneurysm in a 65-year-old man with a history of alcoholic liver cirrhosis, who presented with hematemesis secondary to rupture of esophageal varices (grade III), which were successfully treated with endoscopic ligation.
A: Right oblique sagittal view shows a focal fusiform dilatation of the portal venous system at the splenomesenteric confluence (arrow), with a maximum diameter of 37 mm (caliper 1) and lumen partially filled with a slightly echogenic area (arrowhead); B: Right oblique transverse view with color Doppler shows turbulent flow with mosaic color within patent lumen (arrow) and absence of flow within echogenic area (arrowhead); C-G: Contrast-enhanced ultrasound (CEUS) and computed tomography (CT) findings: Right oblique sagittal view shows the CEUS characteristics of the portal venous system aneurysm (PVSA), which is not enhanced in the arterial phase (14 s, arrow, E) and partially hyperenhancing through the portal venous (56 s, arrow, F) and late phase (2 min, arrow, G), with a persistent non-enhancing area in both phases (arrowheads), suggestive of incomplete appositional thrombosis of the PVSA. Axial (D) and coronal maximum intensity projection CT (C) images show the fusiform aneurysm during the portal venous phase, without enhancement in its dependent portion, confirming the diagnosis of partially thrombosed PVSA.
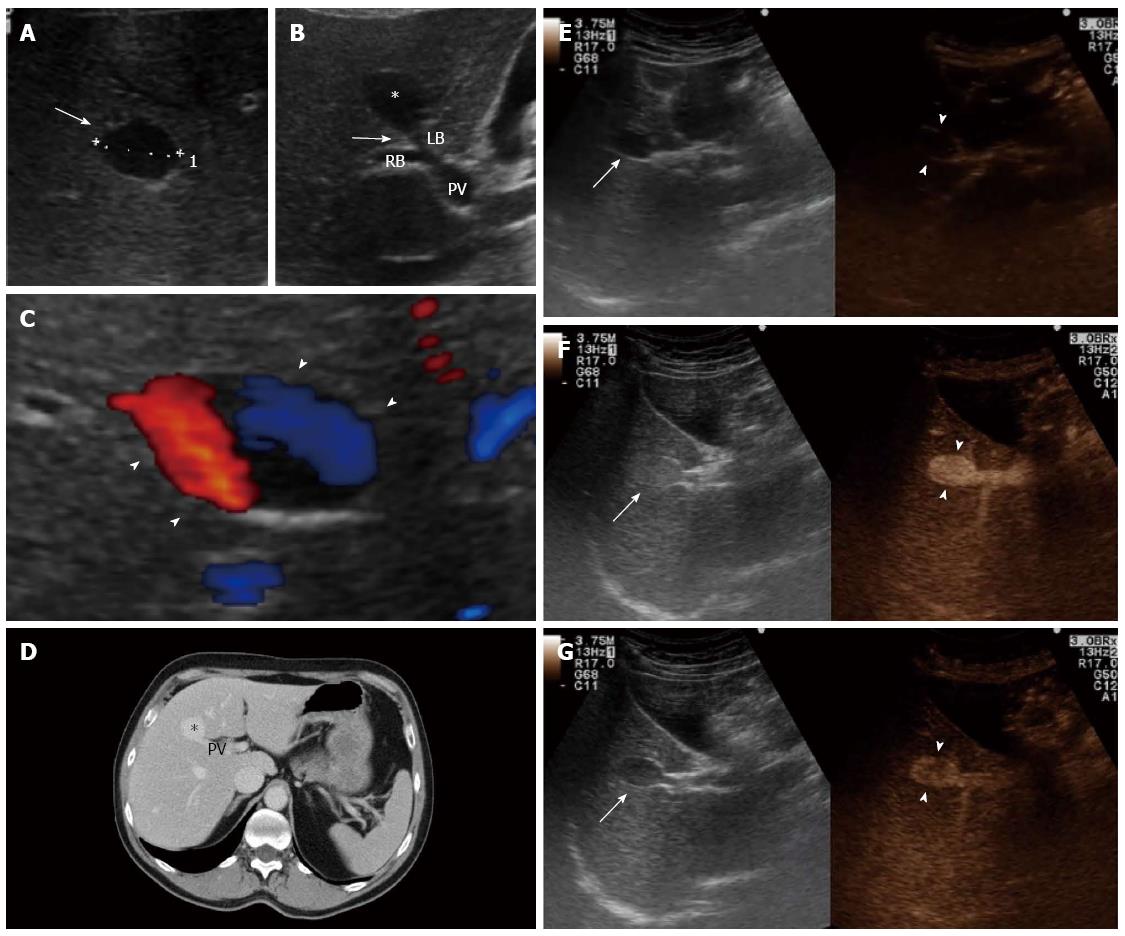
Figure 3 Patient 3: Portal venous system aneurysm in a 64-year-old man who presented with a 3-mo history of dyspepsia.
A: Right transverse subcostal view shows an anechoic lesion without posterior acoustic enhancement in the hepatic segment V (arrow), with a maximum size of 22 mm (caliper 1); B: Right oblique sagittal view shows the direct communication between the lesion (asterisk) and the left branch of the portal vein (arrow); C: Right transverse subcostal view with color Doppler shows “to-and-fro” flow inside the lesion (“Yin-Yang” sign, arrowheads); D-G: Contrast-enhanced ultrasound (CEUS) and computed tomography (CT) findings: Right oblique sagittal view, in dual screen mode, shows the CEUS characteristics of the portal venous system aneurysm (PVSA) (arrows), which is not enhanced through the arterial phase (8 s, arrowheads, E) and completely hyperenhanced with a swirling pattern throughout the portal venous phase (1 min 7 s, arrowheads, F). The PVSA is evident also during the late phase (2 min 28 s, arrowheads, G). Axial CT scan (D) confirmed the presence of sacciform PVSA (asterisk) during the portal phase. PV: Portal vein; RB and LB: Right and left branches of the portal vein, respectively.
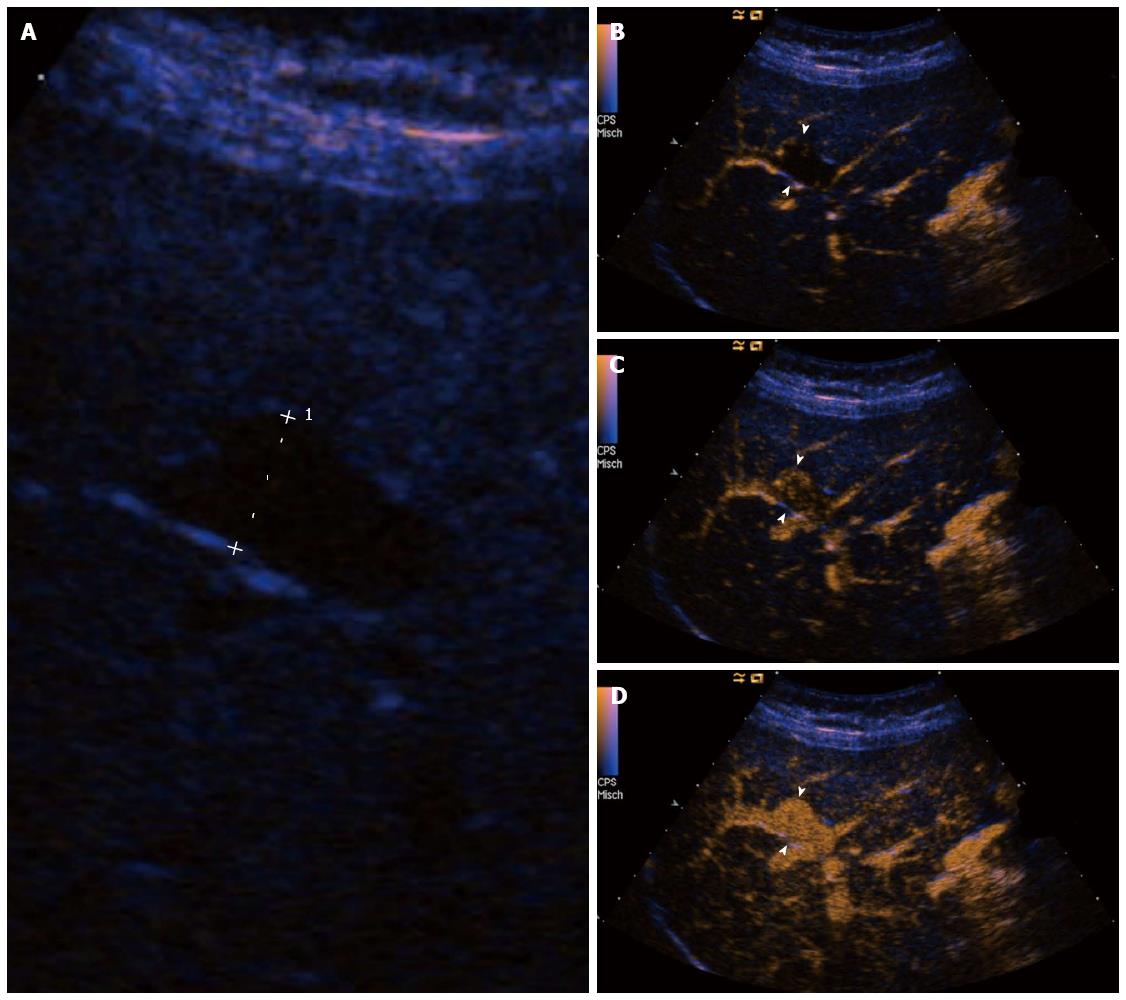
Figure 4 Patient 5: Portal venous system aneurysm in a 58-year-old man who was referred because of elevated liver function tests.
A: Right transverse subcostal view shows a focal saccular dilatation of the right main branch of the portal vein, with a maximum diameter of 25 mm (caliper 1); B-D: Right transverse subcostal view shows the contrast-enhanced ultrasound characteristics of the portal venous system aneurysm (PVSA), which is not enhanced in the arterial phase (16 s, arrowheads, B) and starts to enhance through the early portal venous phase (18 s, arrowheads, C). The PVSA is completely enhanced during portal venous phase (21 s, arrowheads, D).
- Citation: Tana C, Dietrich CF, Badea R, Chiorean L, Carrieri V, Schiavone C. Contrast-enhanced ultrasound in portal venous system aneurysms: A multi-center study. World J Gastroenterol 2014; 20(48): 18375-18383
- URL: https://www.wjgnet.com/1007-9327/full/v20/i48/18375.htm
- DOI: https://dx.doi.org/10.3748/wjg.v20.i48.18375


