©2014 Baishideng Publishing Group Inc.
World J Gastroenterol. Dec 28, 2014; 20(48): 18316-18329
Published online Dec 28, 2014. doi: 10.3748/wjg.v20.i48.18316
Published online Dec 28, 2014. doi: 10.3748/wjg.v20.i48.18316
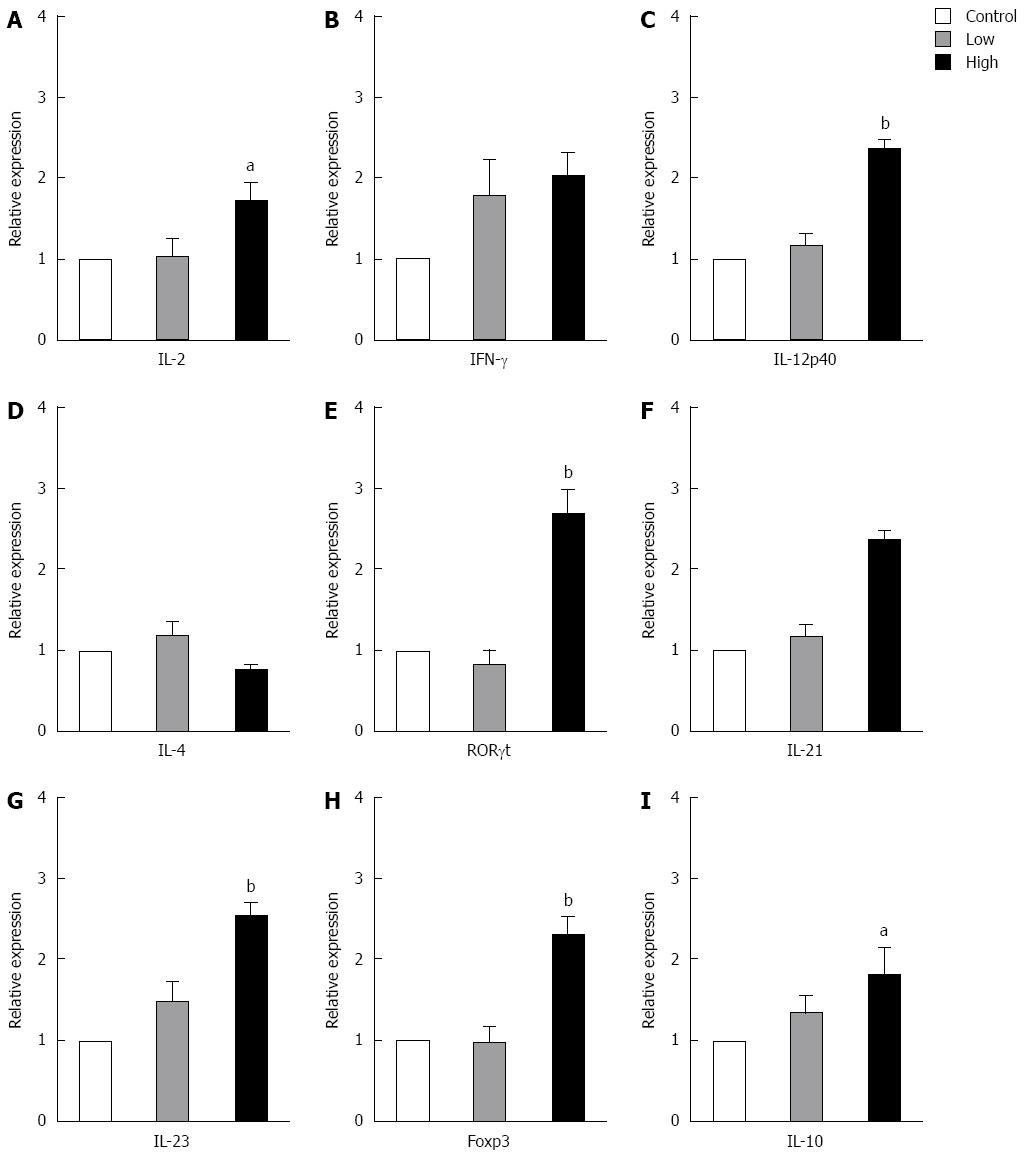
Figure 1 mRNA expression of T cell-related cytokines from mesenteric lymph nodes of normal BALB/c mice fed different doses of Bifidobacterium infantis.
A: IL-2; B: IFN-γ; C: IL-12p40; D: IL-4; E: RORγt; F: IL-21; G: IL-23; H: Foxp3; I: IL-10. Control: Mice from control group; Low: Mice treated with low dose Bifidobacterium infantis (B. infantis); High: Mice treated with high dose B. infantis. Real-time RT-PCR was employed to examine the expression of Th1, Th17 and Foxp3+ Treg related cytokines. Data are from 5 mice per group. Data are expressed as relative expression and the control group was chosen as the calibrator. Data represent mean ± SE. aP < 0.05 vs the control group; bP < 0.01 vs the control group. IL: Interleukin; IFN: Interferon.
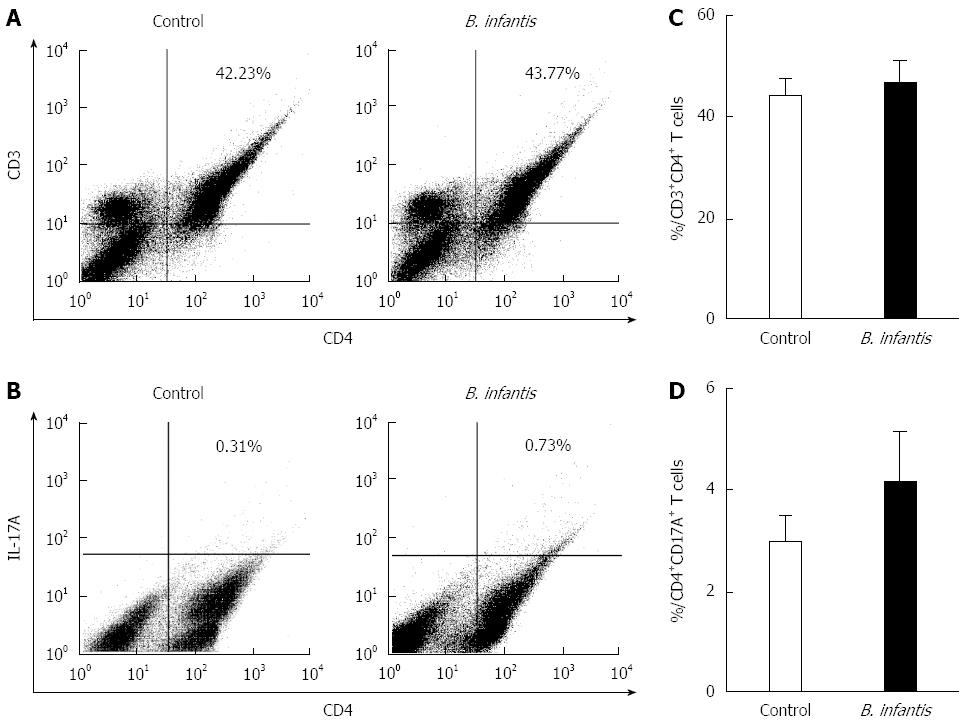
Figure 2 Representative flow plots and levels of CD4+ T and CD4+IL-17A+ T cells in mesenteric lymph nodes from normal mice fed high dose Bifidobacterium infantis.
A: Levels of mesenteric lymph node (MLN) CD4+T cells in PBS-control and Bifidobacterium infantis (B. infantis) treated groups; B: Levels of CD4+IL-17A+T cells in PBS-control and B. infantis treated groups; C: The percentage of MLN CD4+T cells; D: The percentage of CD4+IL-17A+T cells. Results are either shown as mean ± SE from three independent experiments, n = 5 (bar graphs) or as a representative flow cytometry graph.
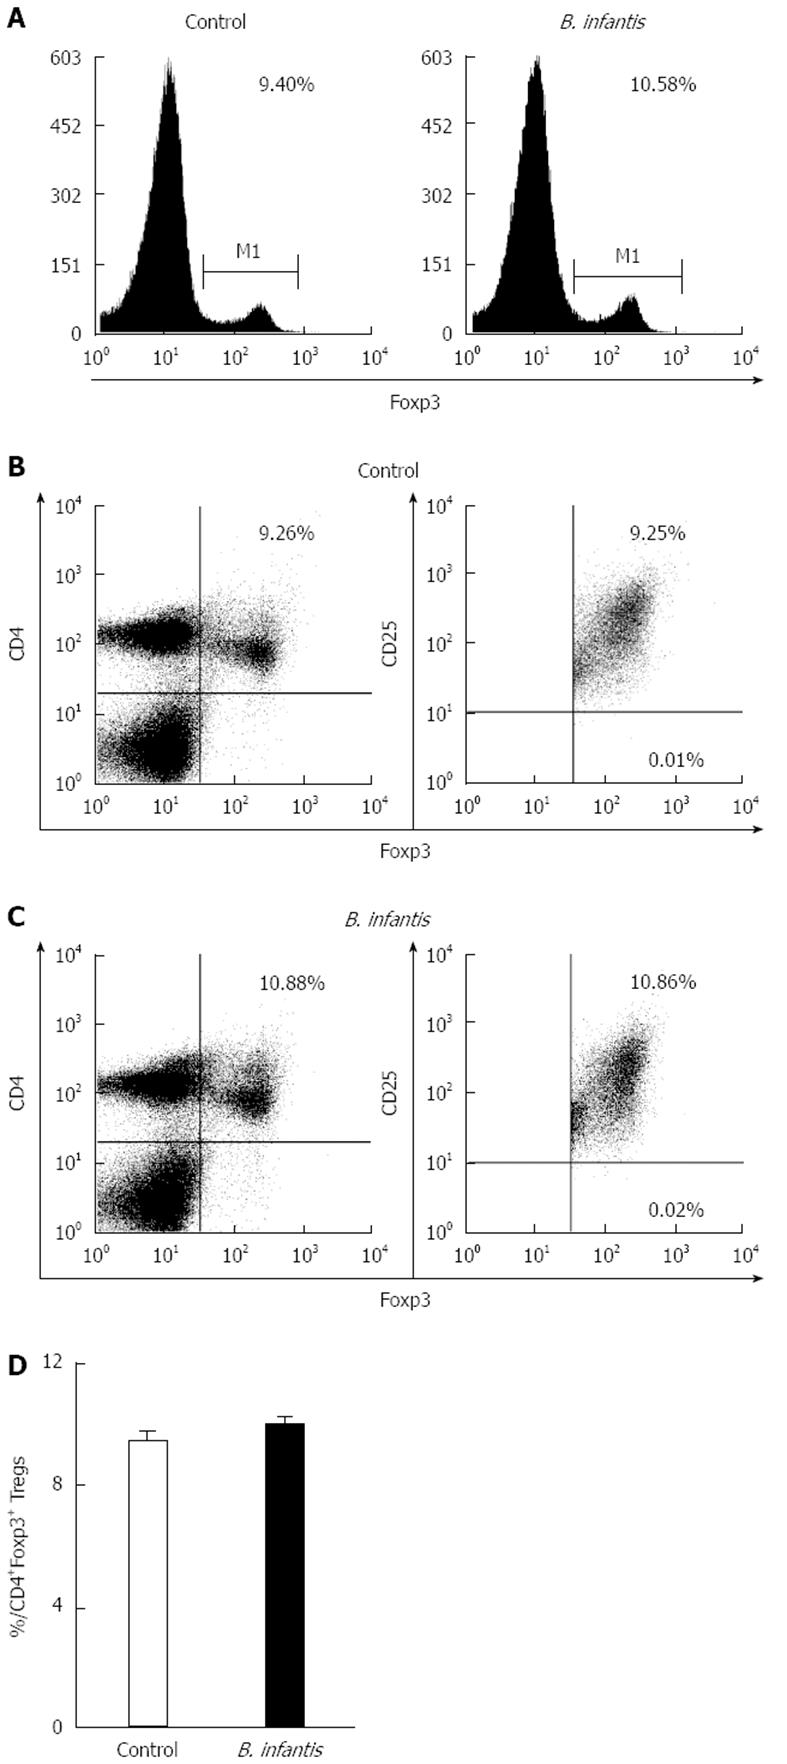
Figure 3 Representative flow plots and levels of Foxp3+ cells in mesenteric lymph nodes from normal mice fed high dose Bifidobacterium infantis.
A: Levels of Foxp3+ cells in mesenteric lymph nodes from PBS-control group and Bifidobacterium infantis (B. infantis) group; B: Levels of CD4+Foxp3+ Tregs from PBS-control group; C: Levels of CD4+Foxp3+ Tregs from B. infantis group; D: The percentage of the CD4+Foxp3+ Tregs. Data are mean ± SE with 5 mice per group from three independent experiments (bar graphs) or as a representative flow cytometry graph.
Figure 4 Representative histological images of colon samples from trinitrobenzene sulfonic acid-induced colitis mice.
A: Colon image from a negative control mouse; B: Colon image from a mouse on day 3 after trinitrobenzene sulfonic acid (TNBS) induction; C: Colon image from a mouse on day 6 after TNBS induction. All images are at the same original magnification (× 40).
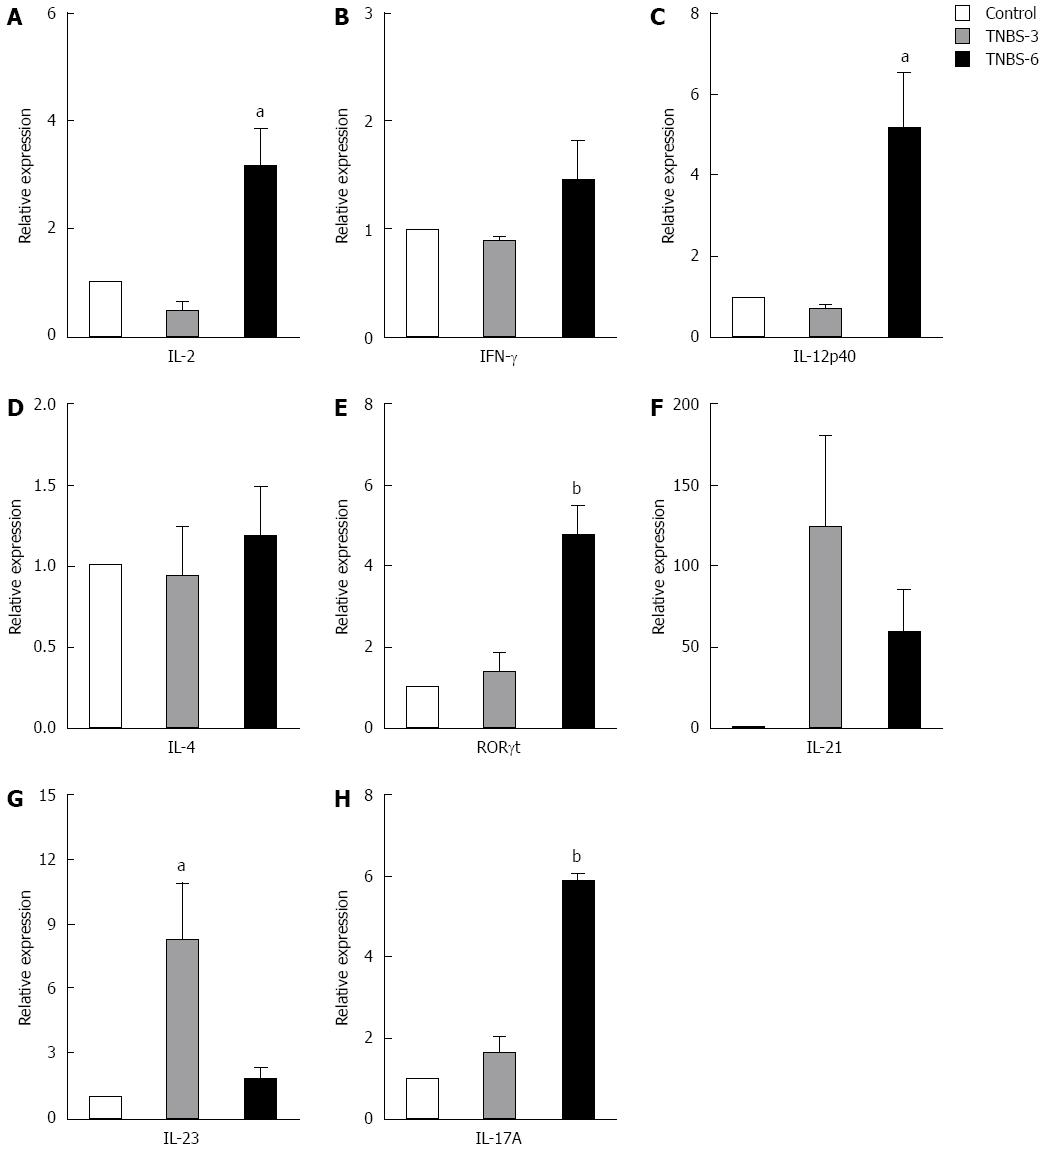
Figure 5 mRNA expression of T cell-related cytokines from mesenteric lymph nodes of trinitrobenzene sulfonic acid-induced colitis mice.
A: IL-2; B: IFN-γ; C: IL-12p40; D: IL-4; E: RORγt; F: IL-21; G: IL-23; H: IL-17A. Real-time RT-PCR was employed to examine the expression of Th1, Th17 and Foxp3+ Treg related cytokines. Control: In the control group, the animals were administered with PBS; Trinitrobenzene sulfonic acid (TNBS)-3: In the TNBS-3 group, the animals were sacrificed 3 d after TNBS induction; TNBS-6: In the TNBS-6 group, the animals were sacrificed 6 d after TNBS induction. Data are from 5 mice per group. Data are expressed as relative expression and the control group was chosen as the calibrator. Data represent mean ± SE. aP < 0.05 vs the control group; bP < 0.01 vs the control group. IL: Interleukin; IFN: Interferon.
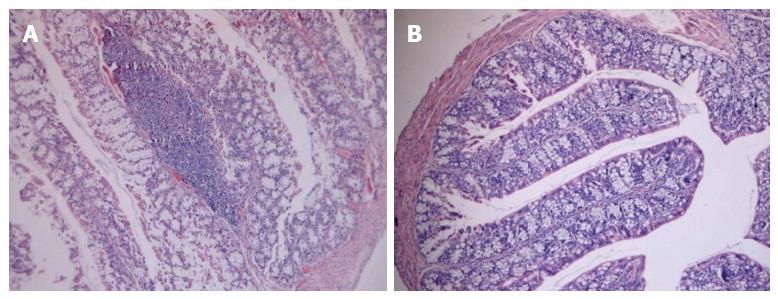
Figure 6 Representative histological images of colon samples from trinitrobenzene sulfonic acid-induced colitis mice fed high dose Bifidobacterium infantis.
A: Colon image from a trinitrobenzene sulfonic acid (TNBS)-induced colitis mouse fed PBS; B: Colon image from a TNBS-induced mouse fed high dose Bifidobacterium infantis. All images are at the same original magnification (× 40).
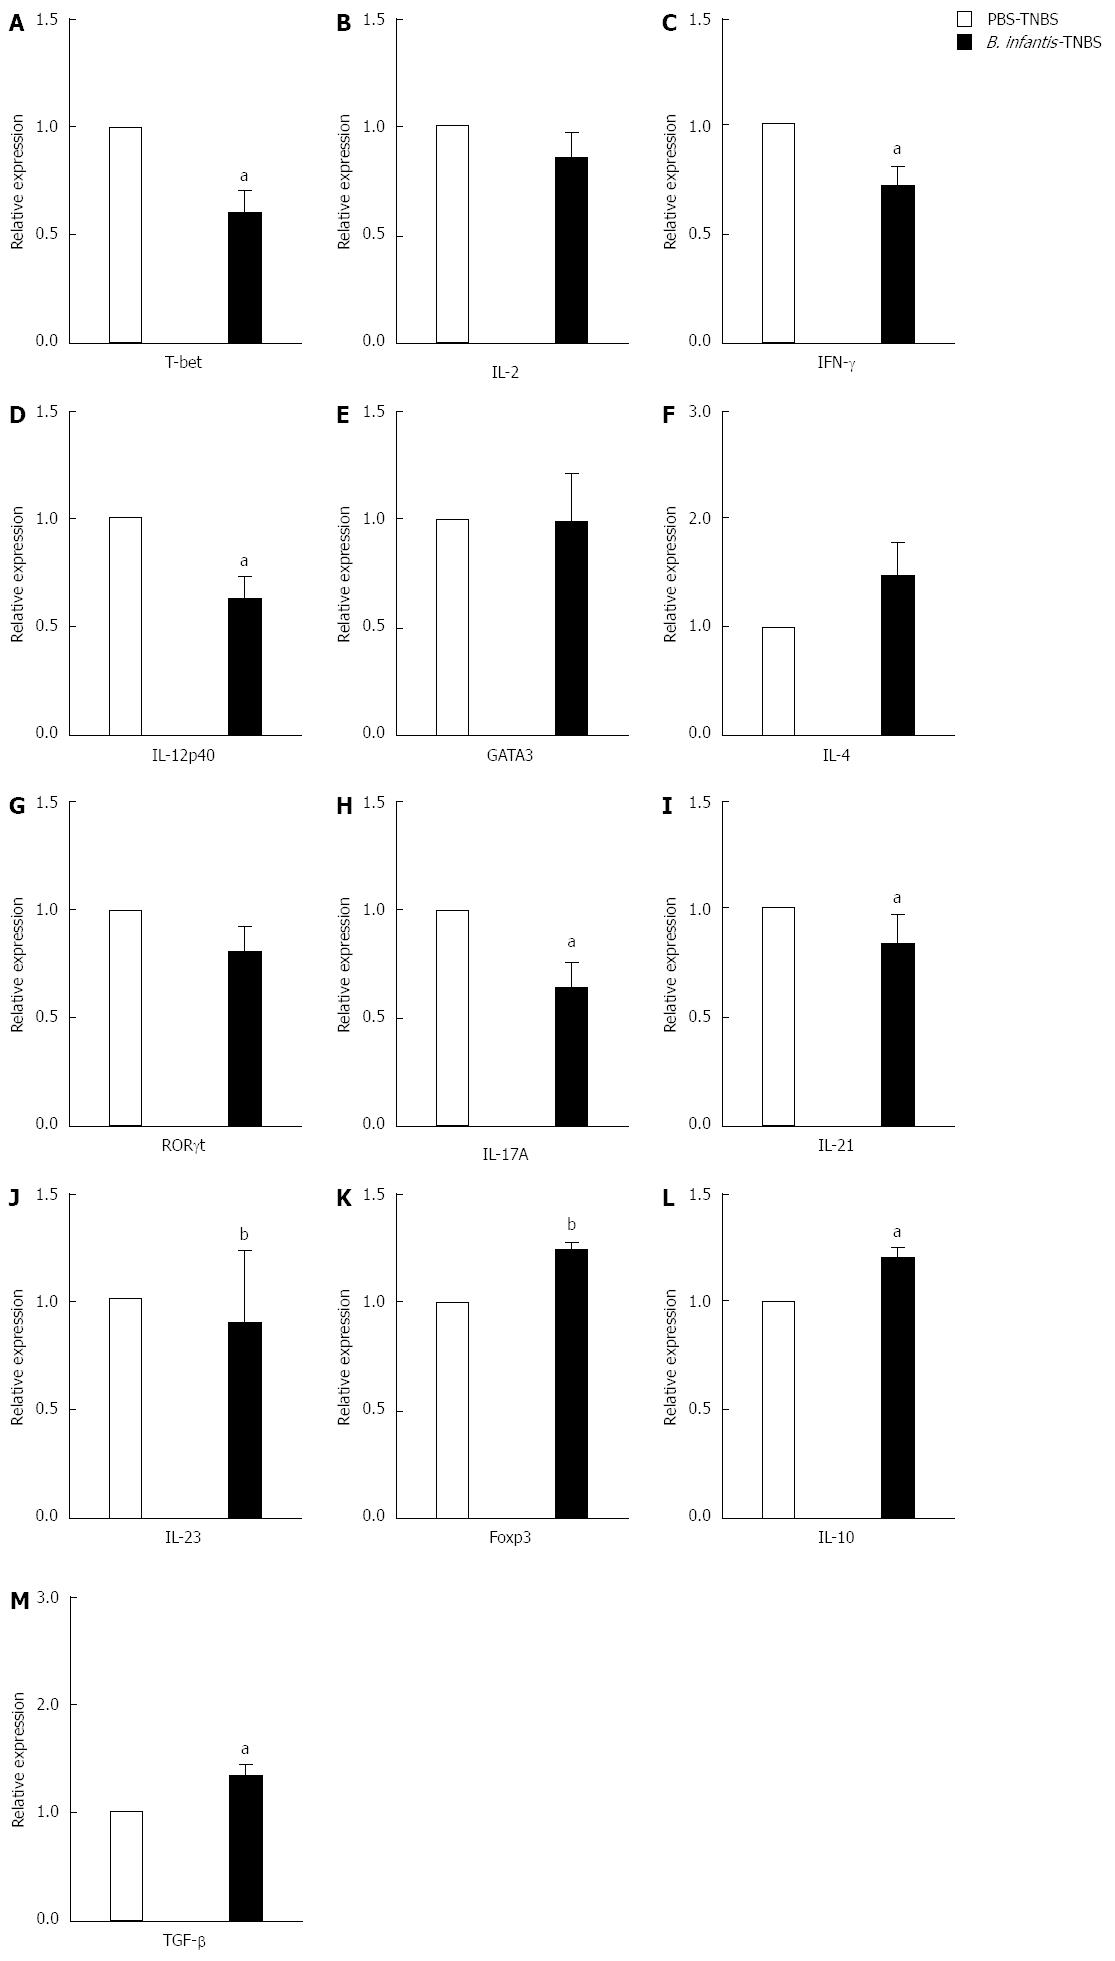
Figure 7 mRNA expression of T cell-related cytokines from mesenteric lymph nodes of trinitrobenzene sulfonic acid-induced colitis mice fed high dose Bifidobacterium infantis.
A: T-bet; B: IL-2; C: IFN-γ; D: IL-12p40; E: GATA3; F: IL-4; G: RORγt; H: IL-17A; I: IL-21; J: IL-23; K: Foxp3; L: IL-10; M: TGF-β. Real-time RT-PCR was employed to examine the expression of Th1, Th17 and Foxp3+ Treg related cytokines. PBS-TNBS: In the PBS-TNBS group, the animals were fed PBS before TNBS induction; Bifidobacterium infantis (B. infantis)-TNBS: In the B. infantis-TNBS group, the animals were fed high dose B. infantis before TNBS induction. Data are expressed as relative expression and the control group was chosen as the calibrator. Data are mean ± SE (n = 5, per group). aP < 0.05 vs PBS-TNBS, bP < 0.01 vs the control group. IL: Interleukin; IFN: Interferon; TNBS: Trinitrobenzene sulfonic acid.
-
Citation: Zuo L, Yuan KT, Yu L, Meng QH, Chung PCK, Yang DH.
Bifidobacterium infantis attenuates colitis by regulating T cell subset responses. World J Gastroenterol 2014; 20(48): 18316-18329 - URL: https://www.wjgnet.com/1007-9327/full/v20/i48/18316.htm
- DOI: https://dx.doi.org/10.3748/wjg.v20.i48.18316


