©2014 Baishideng Publishing Group Inc.
World J Gastroenterol. Dec 21, 2014; 20(47): 17883-17893
Published online Dec 21, 2014. doi: 10.3748/wjg.v20.i47.17883
Published online Dec 21, 2014. doi: 10.3748/wjg.v20.i47.17883
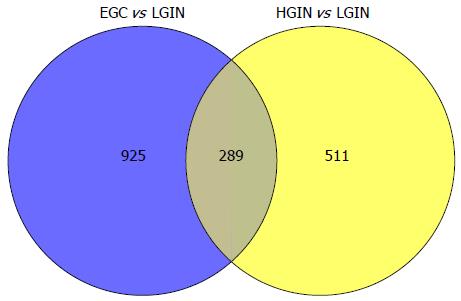
Figure 1 All of the transcripts that were statistically significant both in gastric early-stage adenocarcinoma vs low-grade intraepithelial neoplasia and high-grade intraepithelial neoplasia vs low-grade intraepithelial neoplasia and were involved in the Gene Ontology enrichment analysis.
LGIN: Low-grade intraepithelial neoplasia; EGC: Early-stage adenocarcinoma; HGIN: High-grade intraepithelial neoplasia.
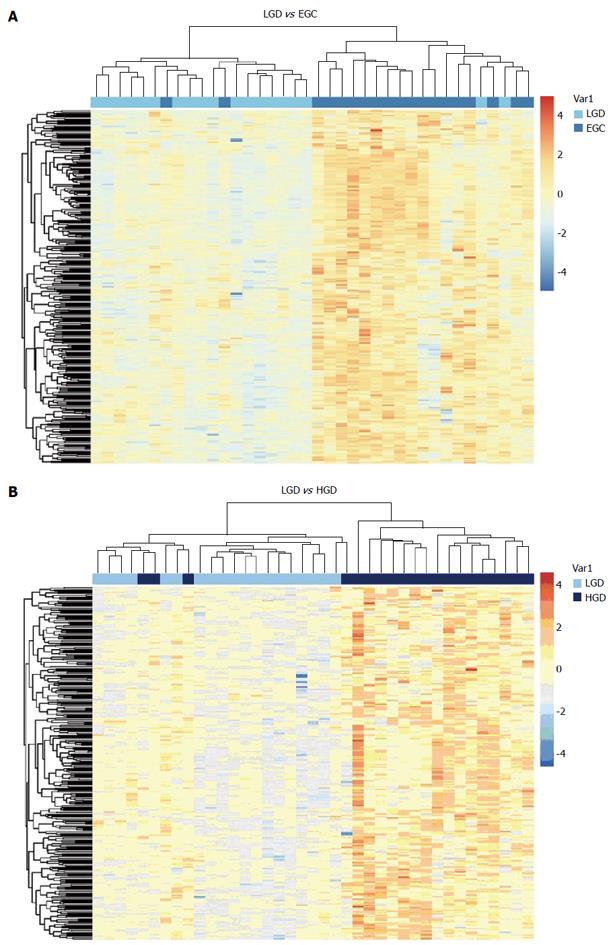
Figure 2 Unsupervised cluster analysis of gastric low-grade intraepithelial neoplasia and early-stage adenocarcinoma (A), low-grade intraepithelial neoplasia and high-grade intraepithelial neoplasia (B) tissue samples with the 289 differentially expressed transcripts.
The transverse blue bar indicates the histopathological type of the tissue samples: A: Light blue, low-grade intraepithelial neoplasia (LGIN); Dark blue, early-stage adenocarcinoma (EGC); B: Light blue, LGIN; Dark blue, high-grade intraepithelial neoplasia (HGIN). Each column represents a sample, and each row represents a transcript. The expression abundance from low levels to high levels is shown in colors from blue to red.
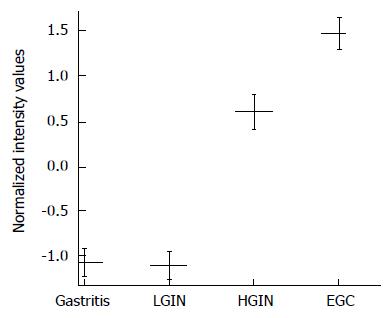
Figure 3 G0S2 expression is increased in gastric high-grade intraepithelial neoplasia and early-stage adenocarcinoma in the microarray.
The G0S2 mRNA expression in gastric high-grade intraepithelial neoplasia (HGIN), tissue shows a statistically significant elevation compared with that of low-grade intraepithelial neoplasia (LGIN). No statistically significant difference in G0S2 expression was found between HGIN and early-stage adenocarcinoma (EGC). The results are expressed as the mean ± SE.
Figure 4 G0S2 expression was validated by quantitative polymerase chain reaction in the independent samples.
The results are shown as the mean ± SE. -ΔCTG0S2 represents the expression level of G0S2. The differences of -ΔCTG0S2 in the 4 groups [low-grade intraepithelial neoplasia (LGIN), high-grade intraepithelial neoplasia (HGIN), early-stage adenocarcinoma (EGC) and gastritis] were compared using an analysis of variance (one-way ANOVA). A test for the homogeneity of variances shows P = 0.105, indicating that the variances are equal. The mean difference between LGIN and HGIN was statistically significant (P = 0.004). The mean difference between LGIN and EGC was statistically significant (P < 0.001).
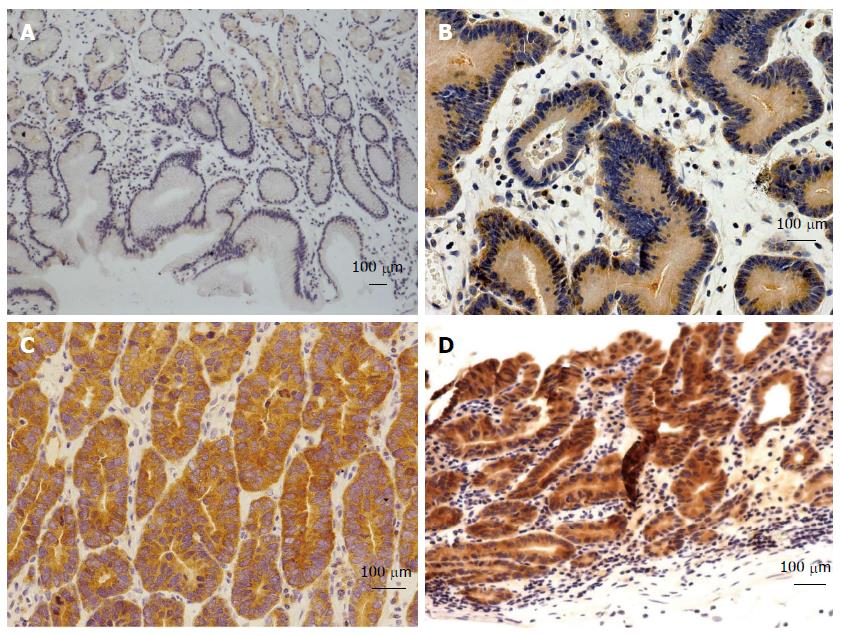
Figure 5 Representative immunohistochemistry for G0S2 in gastric samples.
Representative samples are shown from G0S2 (A) chronic gastritis tissues with negative expression, and G0S2 (B) low-grade intraepithelial neoplasia tissues with low expression, G0S2 (C) high-grade intraepithelial neoplasia tissues with medium expression, and G0S2 (D) early-stage adenocarcinoma tissues with high expression (bar represents 100 μm).
- Citation: Xu X, Feng L, Liu Y, Zhou WX, Ma YC, Fei GJ, An N, Li Y, Wu X, Yao F, Cheng SJ, Lu XH. Differential gene expression profiling of gastric intraepithelial neoplasia and early-stage adenocarcinoma. World J Gastroenterol 2014; 20(47): 17883-17893
- URL: https://www.wjgnet.com/1007-9327/full/v20/i47/17883.htm
- DOI: https://dx.doi.org/10.3748/wjg.v20.i47.17883


