Copyright
©2014 Baishideng Publishing Group Inc.
World J Gastroenterol. Dec 21, 2014; 20(47): 17839-17850
Published online Dec 21, 2014. doi: 10.3748/wjg.v20.i47.17839
Published online Dec 21, 2014. doi: 10.3748/wjg.v20.i47.17839
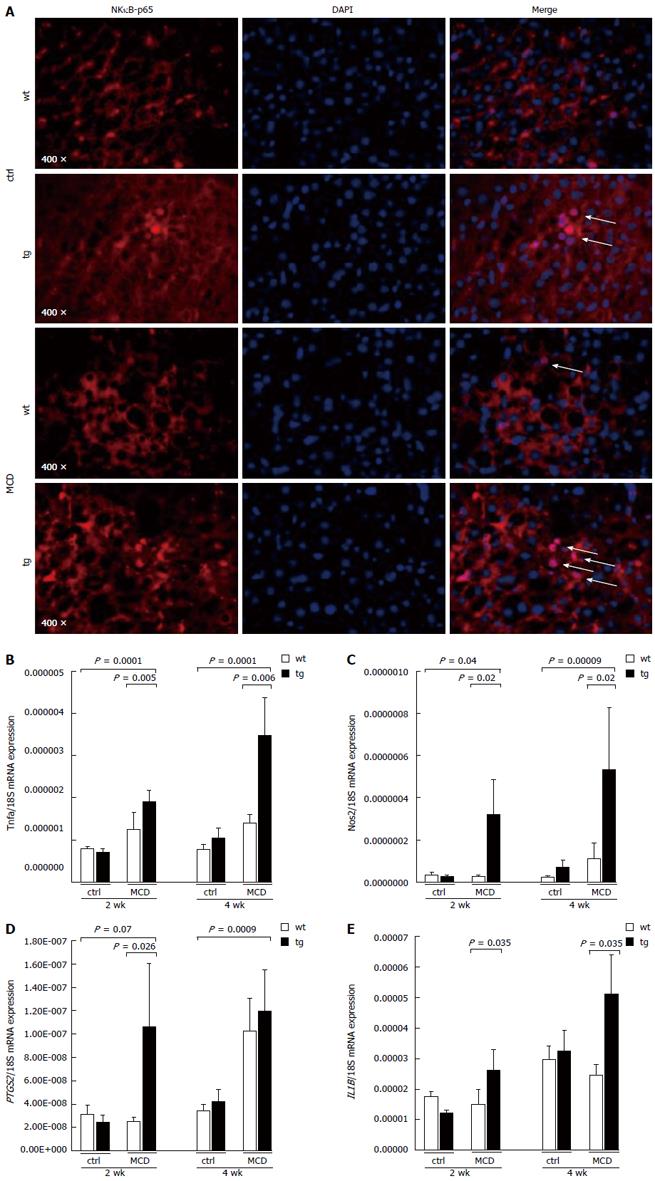
Figure 1 p62 expression amplifies inflammation.
A: Immunofluorescent staining with anti-nuclear factor kappa B (NF-κB)-p65 (red, left panel), 4’,6-diamidino-2-phenylindole (DAPI) for nuclei (blue, middle panel), and merge (right panel) shows activation of NF-κB after four weeks on the methionine-choline deficient (MCD) diet through p65 translocation to the nucleus (white arrows) (original magnification: × 400); B-E: Gene expression analysis from quantitative real-time reverse transcription-polymerase chain reaction (RT-PCR) of NF-κB target genes with tumor necrosis factor (TNF) (B), inducible nitric oxide synthase 2 (NOS2) (C), prostaglandin-endoperoxide synthase 2 (PTGS/COX2) (D), and interleukin 1B (IL-1B) (E) from whole livers are expressed as a ratio against the housekeeping gene, 18S. Data are presented as the mean ± SEM (n = 10-12). ctrl: Control; wt: Wild type; tg: Transgenie.
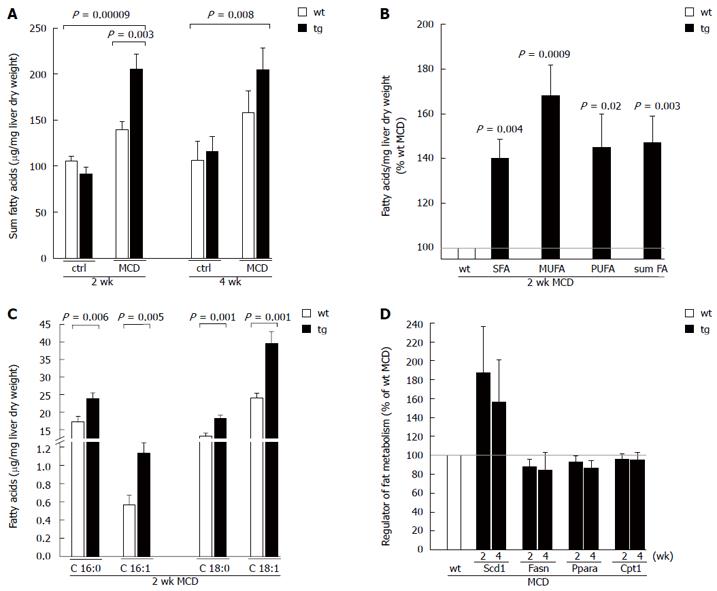
Figure 2 p62 alters the fatty acid pattern.
A: Sum of all fatty acids in mice fed the methionine-choline deficient (MCD) or ctrl diet for two and four weeks. Liver tissues were lyophilized, lipids were hydrolyzed, and fatty acids (FA) were analyzed by gas-chromatography mass-spectrometry (GC-MS); B: Sum of the saturated fatty acids (SFA), monounsaturated fatty acids (MUFA), polyunsaturated fatty acids (PUFA), and all fatty acids (sum FA) from animals fed the MCD diet for two weeks are presented as the mean ± SEM (n = 9-12). Data are displayed as the percentage of MCD-fed wild-type mice, which were set to 100%, each; C: Palmitic acid (C16:0), palmitoleic acid (C16:1), stearic acid (C18:0), and oleic acid (C18:1) are presented as the mean ± SEM (n = 9-12); D: Relative hepatic mRNA expression of stearoyl-CoA desaturase (SCD) 1, fatty acid synthase (FASN), peroxisome proliferator-activated receptor a (PPARa), and carnitine palmitoyl transferase (CPT) 1a from mice fed the MCD diet for two and four weeks were normalized against the housekeeping gene 18S and are shown as the percentage of MCD-fed wild-type mice, which were set to 100%, each. Data are presented as the mean ± SEM (n = 10-12). tg: Transgenic; wt: Wild-type; ctrl: Control.
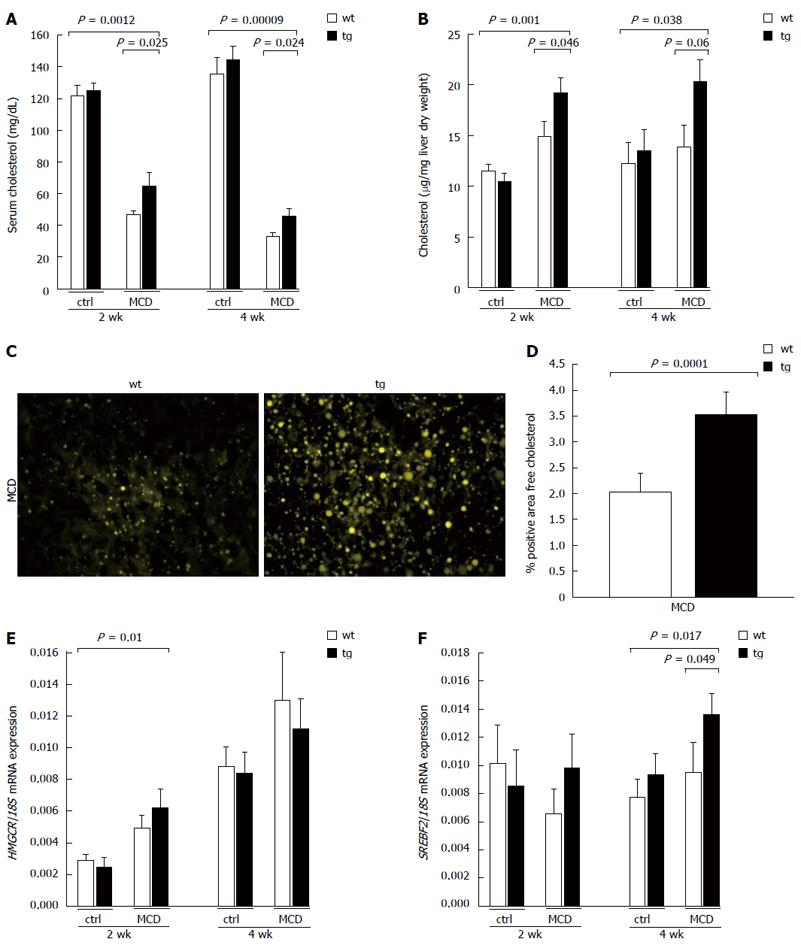
Figure 3 p62 expression elevates serum and liver cholesterol.
A, B: Hepatic (A) and serum (B) cholesterol concentrations in mice fed the respective diet for two or four weeks; C, D: Representative cryosections stained with Filipin for hepatic free cholesterol in mice fed the methionine-choline deficient (MCD) diet for four weeks (original magnification: × 400) (C) with corresponding quantification (D) (mean out of five randomly picked sections on the slide); E, F: Relative hepatic mRNA expression of 3-hydroxy-3-methyl-glutaryl-CoA reductase (HMG-CoA reductase or HMGCR) (E) and sterol regulatory element binding transcription factor 2 (SREBF2) (F) are shown as a ratio against the housekeeping gene, 18S. Data are presented as the mean ± SEM (n = 10-12). tg: Transgenic; wt: Wild-type; ctrl: Control.
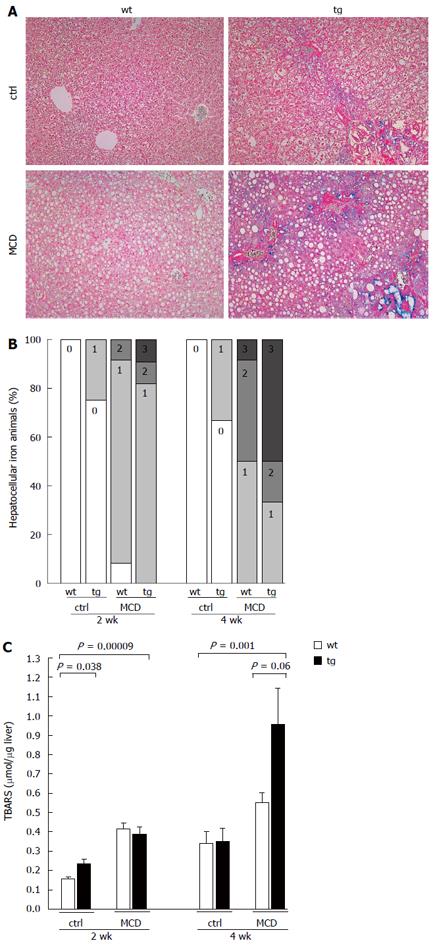
Figure 4 p62 expression leads to increased iron accumulation and reactive oxygen species production.
A, B: Representative paraffin-embedded liver sections stained with Prussian blue for iron accumulation from animals fed the respective diet for four weeks (original magnification × 200 and × 500 for inserts) (A) with the corresponding hepatocellular iron score (B) for all time points (for scoring, see supplement S1); C: Hepatic thiobarbituric acid reactive substances (TBARS) were measured to indicate lipid peroxidation and are presented as the mean ± SEM (n = 10-12). tg: Transgenic; wt: Wild-type; ctrl: Control; MCD: Methionine and choline deficient.
- Citation: Simon Y, Kessler SM, Gemperlein K, Bohle RM, Müller R, Haybaeck J, Kiemer AK. Elevated free cholesterol in a p62 overexpression model of non-alcoholic steatohepatitis. World J Gastroenterol 2014; 20(47): 17839-17850
- URL: https://www.wjgnet.com/1007-9327/full/v20/i47/17839.htm
- DOI: https://dx.doi.org/10.3748/wjg.v20.i47.17839


