Copyright
©2014 Baishideng Publishing Group Inc.
World J Gastroenterol. Dec 7, 2014; 20(45): 17065-17074
Published online Dec 7, 2014. doi: 10.3748/wjg.v20.i45.17065
Published online Dec 7, 2014. doi: 10.3748/wjg.v20.i45.17065
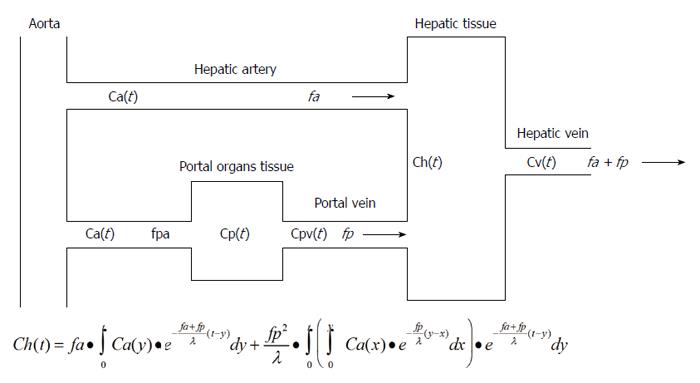
Figure 1 Schema of the dual supply model and the basic equation for hepatic blood flow of xenon computed tomography.
Based on the changes over time in CT values for the hepatic tissues and the spleen, hepatic tissue blood flow (TBF) was calculated by applying the Fick principle using Kety-Schmidt’s equation to obtain arterial blood flow (fa), portal blood flow (fp), and lambda (λ) values in the human liver on a pixel-by-pixel basis in xenon computed tomography (Xe-CT). This dual blood supply model for the liver was used to calculate hepatic blood flow by Xe-CT. Ch(t), Ca(t), Cv(t), and Cpv(t) represent time-dependent Xe concentrations in the liver tissue, arterial blood, venous blood, and portal blood, respectively. Arterial and portal blood flows per unit volume of liver tissue are indicated by fa and fp, respectively. Cp(t) represents the time-dependent Xe concentration in the portal organ tissue, and fpa indicates blood flow per unit volume of portal organ tissue.
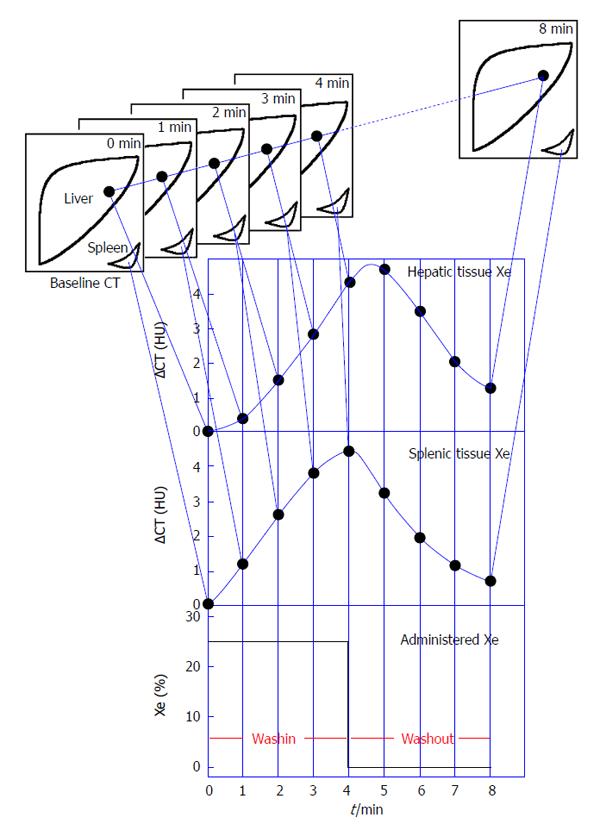
Figure 2 Measuring methods of hepatic tissue blood flow using xenon computed tomography.
Xenon concentration in inhaled gas was 25%, and a 4-min wash-in and 4-min wash-out were used. Computed tomography (CT) at each of the 4 levels was performed 8 times at 1-min intervals. Patients held their breath during each scan to prevent movement of the liver caused by respiration. CT of the spleen was used to measure arterial xenon concentrations.
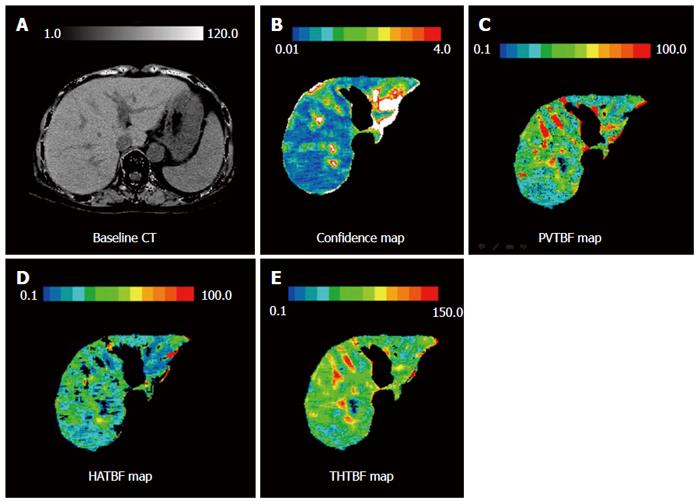
Figure 3 Measurement of hepatic tissue blood flow and confidence values obtained using xenon computed tomography.
A: Baseline computed tomography; B: Confidence map. The original blood flow maps were modified by automatically excluding any pixels with confidence values exceeding the threshold in the confidence map. The white areas on the confidence map indicate regions of low reliability and were automatically excluded. Confidence values indicate the difference between theoretical and actual changes over time on xenon computed tomography (Xe-CT); C: Portal tissue blood flow (PVTBF) map; D: Hepatic arterial tissue blood flow (HATBF) map; E: Total hepatic tissue blood flow (THTBF) map. Maps were created for portal venous TBF (PVTBF; C), hepatic arterial TBF (HATBF; D), the Xe solubility coefficient, and confidence values for each pixel in the liver based on changes over time in the Xe-CT numbers in the hepatic tissue and spleen.
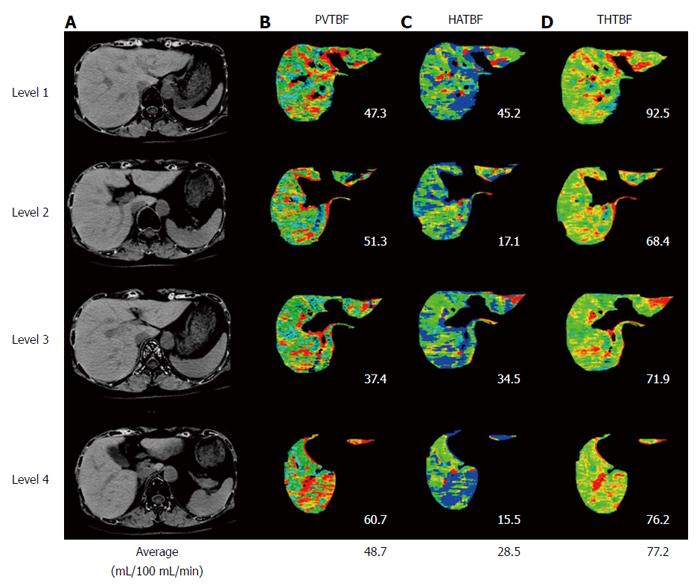
Figure 4 Measurement of hepatic tissue blood flow using xenon computed tomography.
Measurement of hepatic tissue blood flow (TBF) and confidence values obtained using xenon computed tomography (Xe-CT). Maps were created for portal venous TBF (PVTBF; B), hepatic arterial TBF (HATBF; C), the Xe solubility coefficient, and confidence values for each pixel in the liver on the basis of changes over time in the Xe-CT numbers in the hepatic tissue and spleen. A: Base line CT; B: Portal blood flow map; C: Arterial blood flow map; D: Total hepatictissue blood flow (THTBF) map.
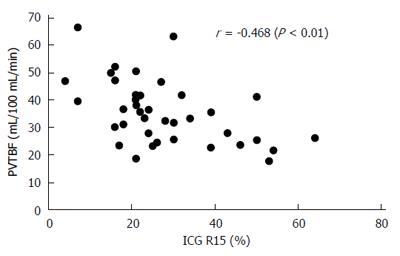
Figure 5 Correlation between portal venous tissue blood flow and retention rate of indocyanine green 15 min after administration.
Portal venous tissue blood flow (PVTBF) was significantly negatively correlated with retention rate of indocyanine green 15 min after administration (ICG R15) (r = -0.442, P < 0.01).
Figure 6 Correlation between albumin, ammonia, and venous tissue blood flow.
There was a significant correlation between portal venous tissue blood flow (PVTBF) and albumin (Alb) (r = 0.2499, P < 0.05) (A) and ammonia (NH3) tended to have an inverse correlation with PVTBF (r = -0.2428, P = 0.0894) (B).
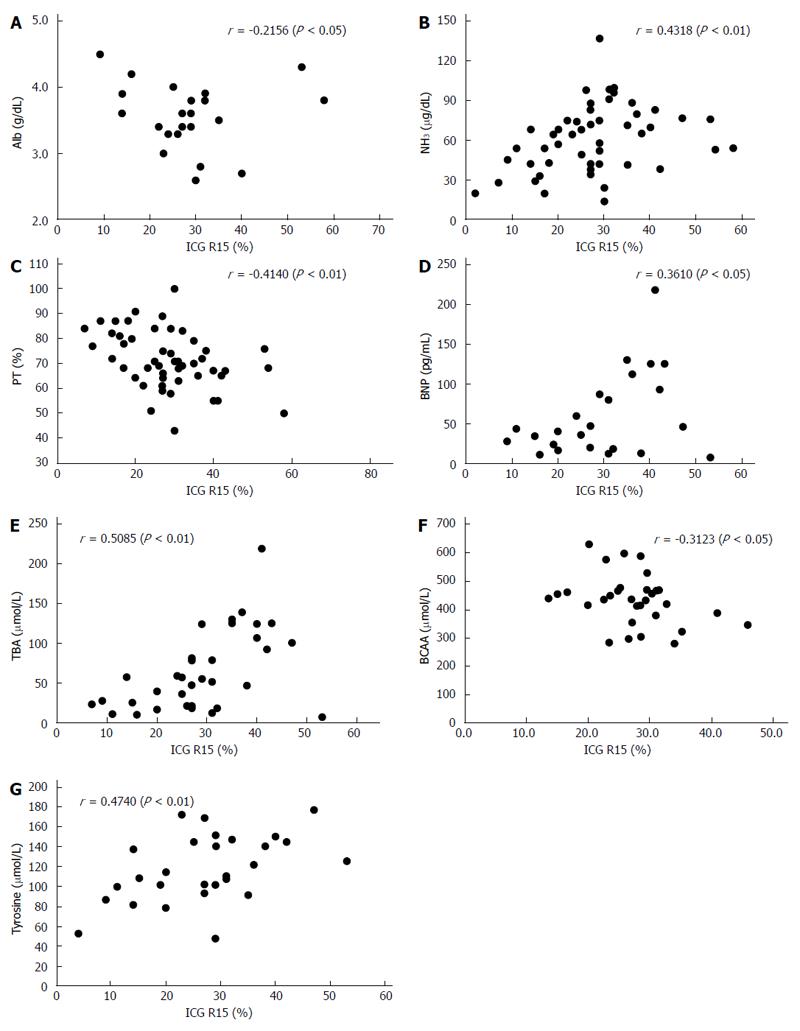
Figure 7 Correlation between liver function and retention rate of indocyanine green 15 min after administration.
There were many significant correlations between retention rate of indocyanine green 15 min after administration (ICG R15) and liver function parameters, including albumin (Alb) (A), ammonia (NH3) (B), prothrombin time (PT) (C), brain natriuretic peptide (BNP) (D), total bile acid (TBA) (E), branched-chain amino acids (BCAA) (F), and tyrosine (G).
- Citation: Takahashi H, Shigefuku R, Yoshida Y, Ikeda H, Matsunaga K, Matsumoto N, Okuse C, Sase S, Itoh F, Suzuki M. Correlation between hepatic blood flow and liver function in alcoholic liver cirrhosis. World J Gastroenterol 2014; 20(45): 17065-17074
- URL: https://www.wjgnet.com/1007-9327/full/v20/i45/17065.htm
- DOI: https://dx.doi.org/10.3748/wjg.v20.i45.17065


