Copyright
©2014 Baishideng Publishing Group Inc.
World J Gastroenterol. Dec 7, 2014; 20(45): 17049-17064
Published online Dec 7, 2014. doi: 10.3748/wjg.v20.i45.17049
Published online Dec 7, 2014. doi: 10.3748/wjg.v20.i45.17049
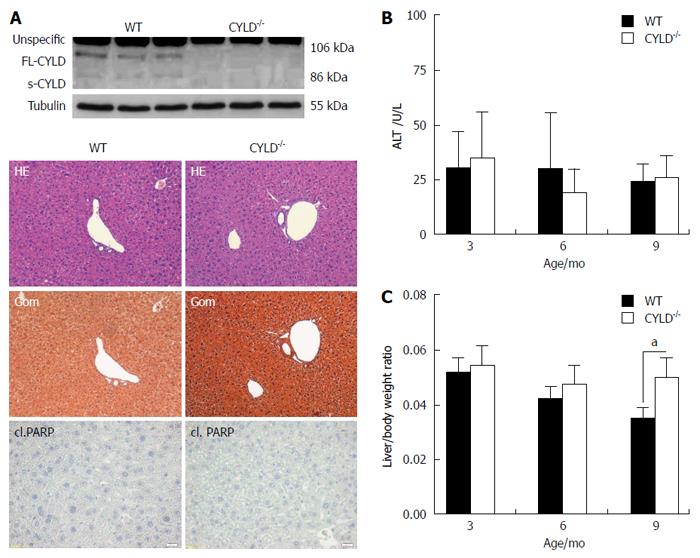
Figure 1 Liver phenotype of CYLD-/- mice.
A: Western blot analysis of liver lysates for CYLD expression (upper panel). Liver histology was unremarkable in both WT and CYLD-/- mice (9 mo old). Spontaneous apoptosis was not detected by cl. PARP immunohistology (Scale bar: 100 μm, lower panel); B: Alanine aminotransferase serum concentration of WT and CYLD-/- mice; C: Liver/body weight ratio of WT and CYLD-/- mice. Values are mean ± SD. n = 6 vs 6. aP < 0.05, WT vs CYLD-/-.
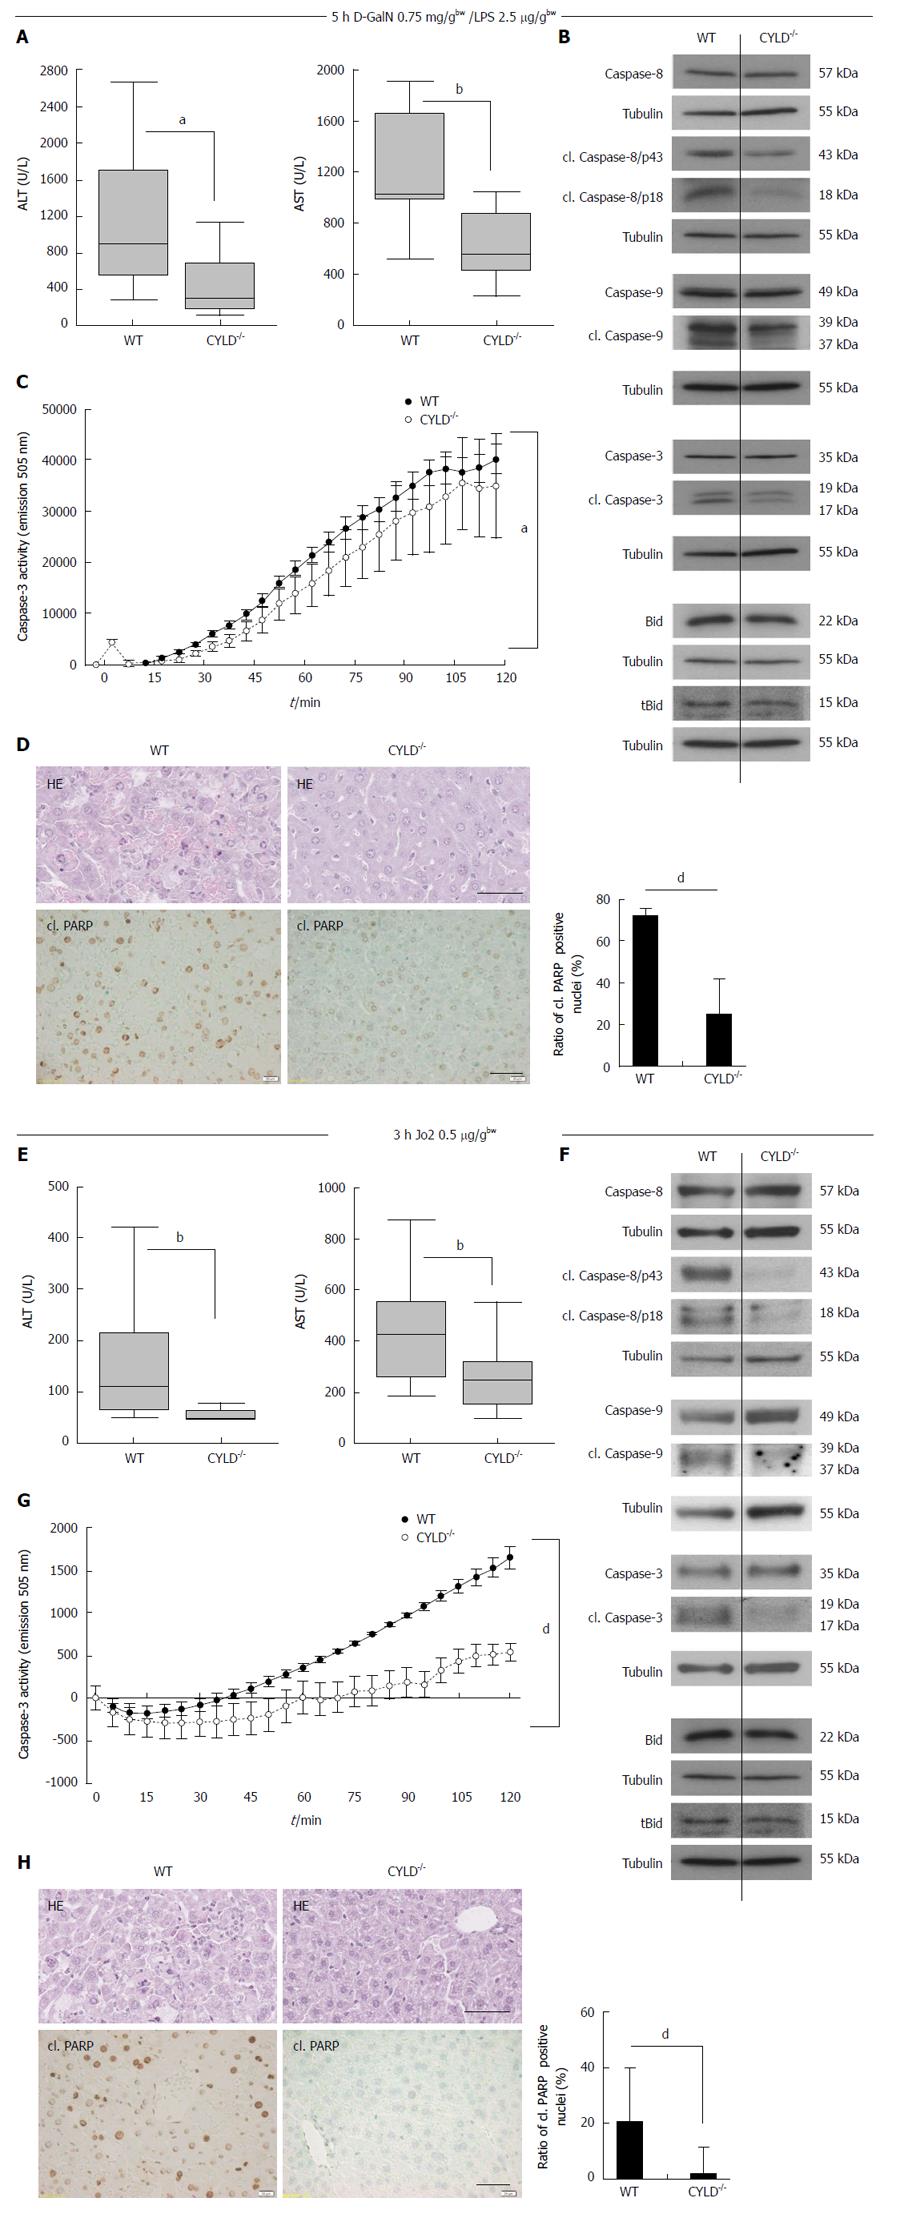
Figure 2 Decreased liver injury in CYLD-/- mice after D-galactosamine/lipopolysaccharide and Jo2 treatment.
A: Box-plots of serum transaminases alanine aminotransferase (ALT) (left panel) and aspartate aminotransferase (AST) (right panel) levels 5 h after D-galactosamine (D-GalN)/lipopolysaccharide (LPS) injection. n = 10 vs 10; B: Western blot analysis of caspase and Bid activation in pooled liver lysates from D-GalN/LPS treated WT and CYLD-/- mice; C: Caspase-3 activity assays of pooled liver lysates from D-GalN/LPS treated WT and CYLD-/- mice. Caspase-3 substrate turnover was measured by fluorometric analysis at the indicated time points; D: WT mice showed more single cell necrosis and apoptosis compared to CYLD-/- mice (HE). Representative immunohistological stainings of cl. PARP (Scale bar: 40 μm) and quantification of cl. PARP positive nuclei. Values represent the mean ± SD; E: Box plots of serum transaminases ALT (left panel) and AST (right panel) levels 3 h after Jo2 injection. n = 10 vs 10; F: Western blot analysis of caspase and Bid activation in pooled liver lysates from Jo2 treated WT and CYLD-/- mice. (G) Caspase-3 activity assays of pooled liver lysates from Jo2 treated WT and CYLD-/- mice. Caspase-3 substrate turnover was measured by fluorometric analysis at the indicated time points; H: Liver cell damage was increased in WT compared to CYLD-/- (HE). Representative immunohistological stainings of cl. PARP (Scale bar: 40 μm) and quantification of cl. PARP positive nuclei. Values represent the mean ± SD. aP < 0.05, WT vs CYLD-/-; bP < 0.01, WT vs CYLD-/-; dP < 0.01, WT vs CYLD-/-.
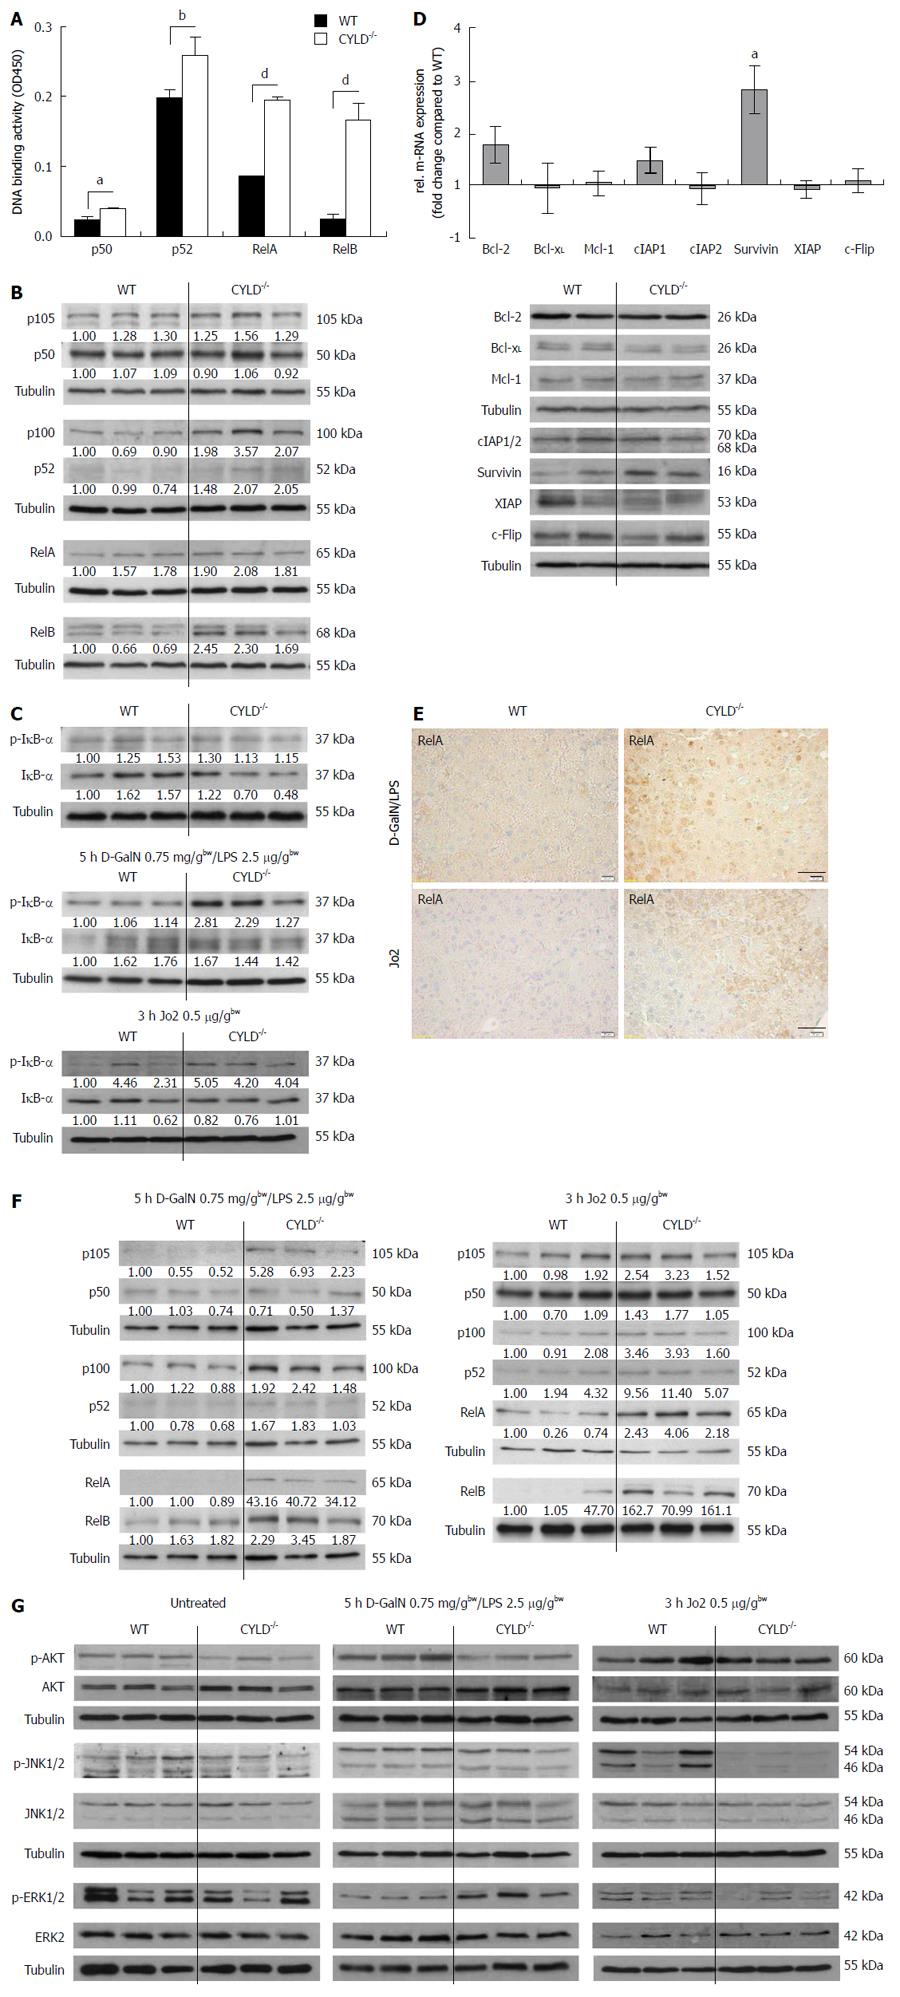
Figure 3 Increased nuclear factor-κB activation in CYLD-/- mice and analysis of other survival signaling pathways.
A: Nuclear factor (NF)-κB transcription factor activation. Assays were performed in triplicates and are representative of two independent experiments. Values represent the mean ± SD; B: Western blot analysis of liver lysates for NF-κB subunits; C: Western blot analysis of liver lysates for p-inhibitor of NF-κB (IκB)-α and IκB-α from untreated (upper), D-GalN/lipopolysaccharide (LPS) (middle) and Jo2 treated (lower panel) WT and CYLD-/- mice; D: Quantitative real-time polymerase chain reaction (upper panel) and Western blot (lower panel) analysis of NF-κB regulated genes. Mean ± SD are presented; E: Representative immunohistological stainings of RelA in liver sections of D-GalN/LPS and Jo2 treated WT and CYLD-/- mice (Scale bar: 40 μm); F: Western blot analysis of liver lysates for NF-κB subunits after D-GalN/LPS (left panel) and Jo2 (right panel) injection in WT and CYLD-/- mice; G: Analysis of survival related pathway activation in untreated (left panels), D-GalN/LPS (middle panels) and Jo2 (right panels) treated WT and CYLD-/- mice by Western blotting of p-Akt/Akt, p-ERK/ERK and p-JNK/JNK. aP < 0.05, WT vs CYLD-/-; bP < 0.01, WT vs CYLD-/-; dP < 0.01, WT vs CYLD-/-.
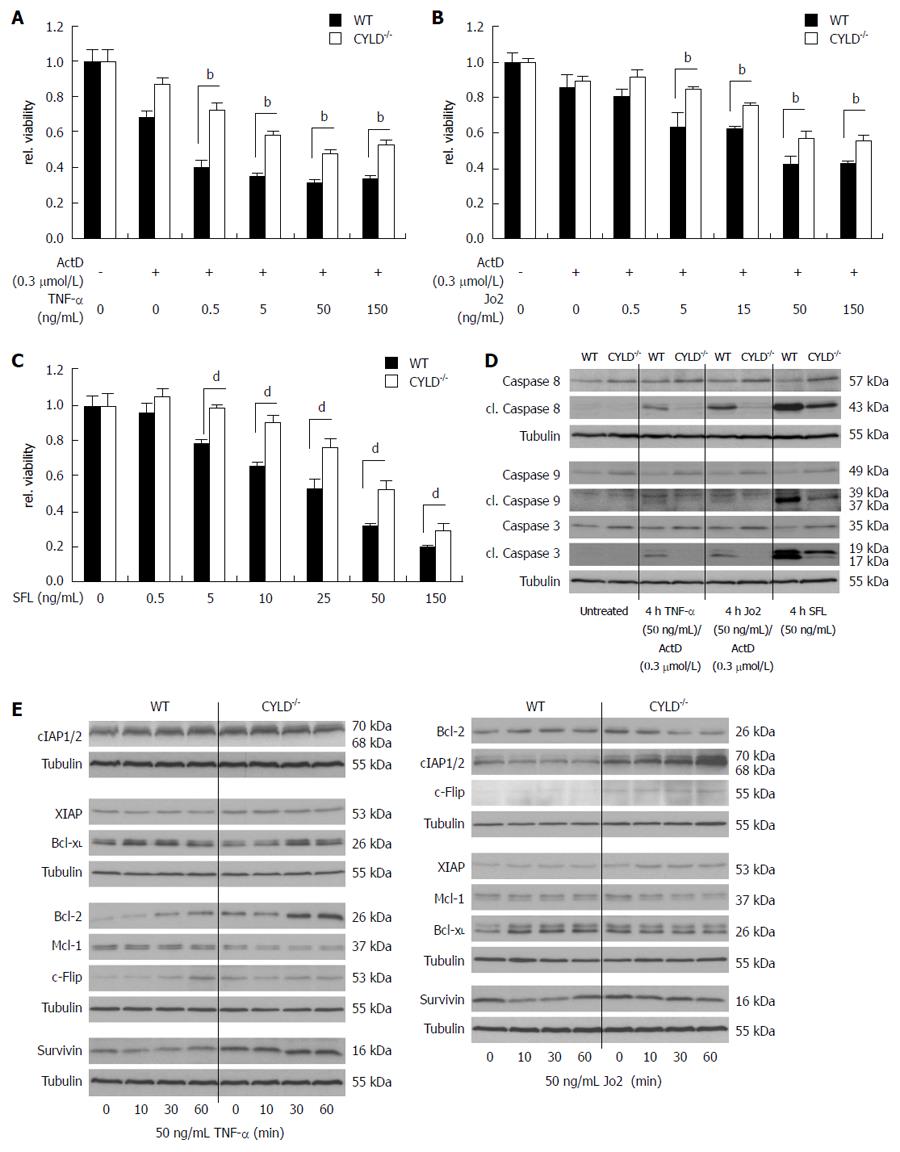
Figure 4 Increased resistance and induction of anti-apoptotic genes in CYLD-/- PMH after death receptor triggering.
A: Freshly isolated PMH were treated for 24 h with increasing concentrations of tumor necrosis factor (TNF)-α and (B) Jo2 in combination with actinomycin D (ActD) as well as with (C) SuperFasLigand (SFL) as indicated; D: Western blot analysis of caspase activation in WT and CYLD-/- PMH after 4 h TNF-α/ActD, Jo2/ActD and SFL treatment with the indicated concentrations; E: Western blot analysis of WT and CYLD-/- PMH for nuclear factor (NF)-κB dependent gene expression after TNF-α (left panel) and Jo2 (right panel) treatment. bP < 0.01, WT vs CYLD-/-; dP < 0.01, WT vs CYLD-/-.
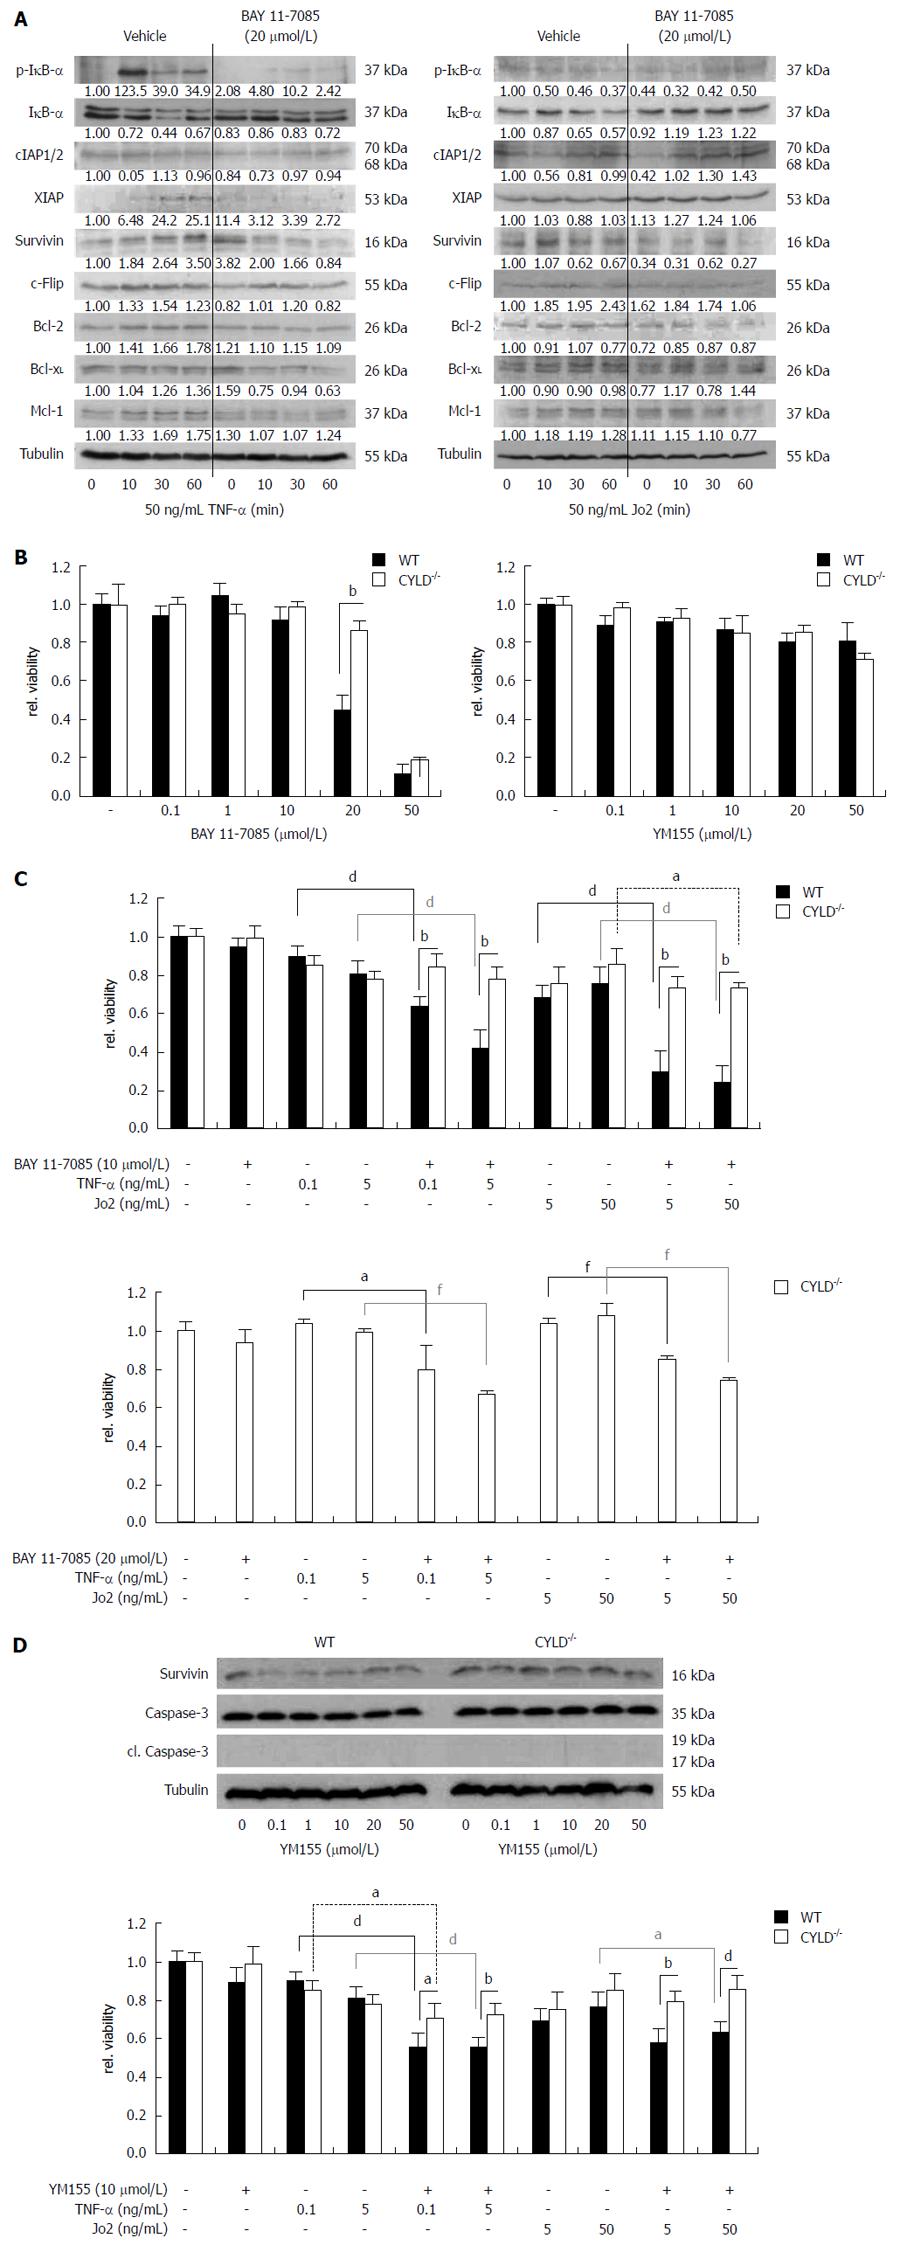
Figure 5 Nuclear factor-κB and survivin inhibition sensitized primary murine hepatocytes towards receptor-mediated cell death.
A: Western blot analysis for nuclear factor (NF)-κB regulated gene expression after tumor necrosis factor (TNF)-R (left panel) and CD95-R (right panel) triggering of CYLD-/- primary murine hepatocytes (PMH) 4 h pre-incubated with BAY 11-7085; B: 24 h treatment of WT and CYLD-/- PMH with increasing concentrations of BAY 11-7085 (left panel) and YM155 (right panel); C: WT and CYLD-/- PMH were pre-incubated with 10 μmol/L BAY-11 7085 for 4 h. Afterwards PMH were treated for 24 h in combination with TNF-α or Jo2 as indicated (upper panel). Pre-incubation of CYLD-/- PMH with 20 μmol/L BAY-11 7085 and following TNF-α or Jo2 treatment (lower panel); D: Western blot analysis for survivin expression in WT and CYLD-/- PMH 24 h after treatment with YM155 as indicated (upper panel). WT and CYLD-/- PMH were pre-incubated with 10 µmol/L YM155 for 4 h. Afterwards PMH were treated for 24 h in combination with TNF-α or Jo2 as indicated (lower panel). DMSO was used as vehicle. Values represent the mean ± SD. aP < 0.05, CYLD-/-vs control group; bP < 0.01, WT vs CYLD-/-; dP < 0.01, WT vs control group; fP < 0.01, CYLD-/-vs control group.
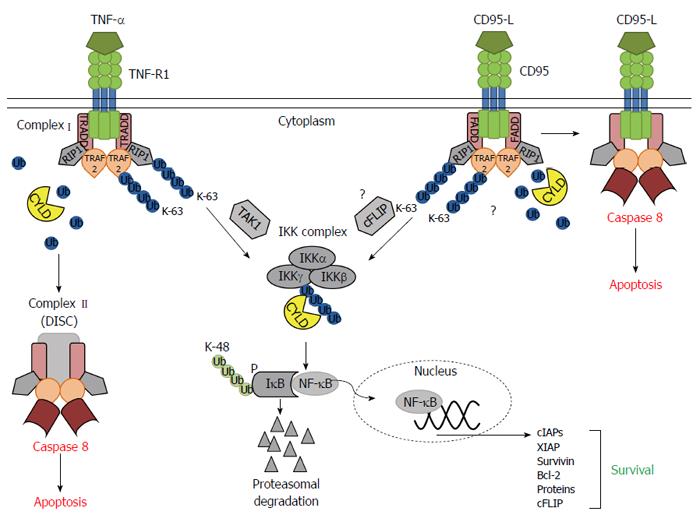
Figure 6 Model of CYLD’s role in receptor mediated apoptosis or survival of hepatocytes.
Binding of tumor necrosis factor (TNF)-α to TNF-R1 induces trimerisation and the recruitment of several adaptor proteins, including TRADD, RIP1 and TRAF2 to form the membrane-proximal complex I. K-63 Deubiquitination of RIP1 and TRAF2 by CYLD promotes the conversion of complex I to complex II building the death inducing signaling complex (DISC) leading to induction of apoptosis. K-63 polyubiquitinated RIP1 and TRAF2 facilitate nuclear factor (NF)-κB activation by the recruitment and activation of IKK and its activating kinase, Tak1[42]. Missing CYLD expression or a lack of CYLDs function leads to increased K-63 polyubiquitination of TRAF2 and RIP1 and therewith to a pronounced activation of the IKK complex. Activation of CD95 promotes recruitment of FADD, thereby assembling the DISC. RIP1 and TRAF2 are also known modulators of CD95 signaling[43]. The role of K-63 polyubiquitination and CYLD in the dynamic of CD95 mediated apoptosis and NF-κB induction is not clear. Known is, that cFLIP is involved in the connection of CD95 induced anti-apoptotic NF-κB signaling via its ability to activate IKK[44]. CYLD can remove K-63 polyubiquitin chains from the IKK regulatory subunit IKKγ thereby inhibiting IKK activation. Increased IKK activation by the absent of CYLD leads to inhibitor of NF-κB phosphorylation, K-48 polyubiquitination and following proteasomal degradation. Subsequently released NF-κB subunits can enter the nucleus to promote transcription of anti-apoptotic genes[42].
- Citation: Urbanik T, Koehler BC, Wolpert L, Elßner C, Scherr AL, Longerich T, Kautz N, Welte S, Hövelmeyer N, Jäger D, Waisman A, Schulze-Bergkamen H. CYLD deletion triggers nuclear factor-κB-signaling and increases cell death resistance in murine hepatocytes. World J Gastroenterol 2014; 20(45): 17049-17064
- URL: https://www.wjgnet.com/1007-9327/full/v20/i45/17049.htm
- DOI: https://dx.doi.org/10.3748/wjg.v20.i45.17049


