Copyright
©2014 Baishideng Publishing Group Inc.
World J Gastroenterol. Nov 7, 2014; 20(41): 15423-15439
Published online Nov 7, 2014. doi: 10.3748/wjg.v20.i41.15423
Published online Nov 7, 2014. doi: 10.3748/wjg.v20.i41.15423
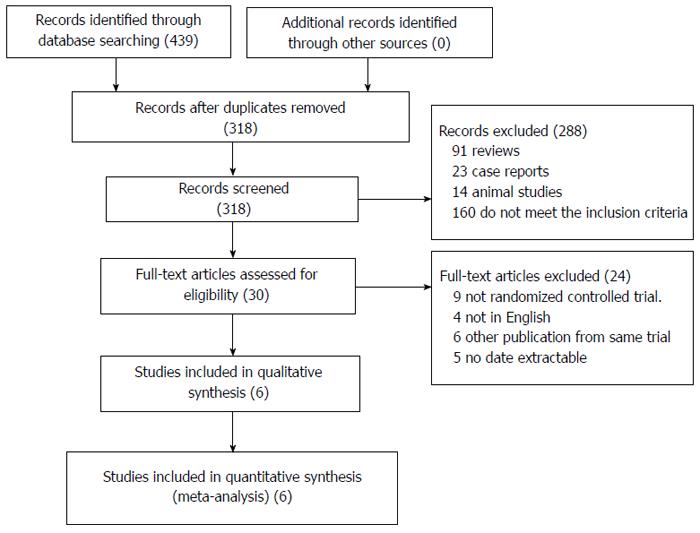
Figure 1 Selection of studies.
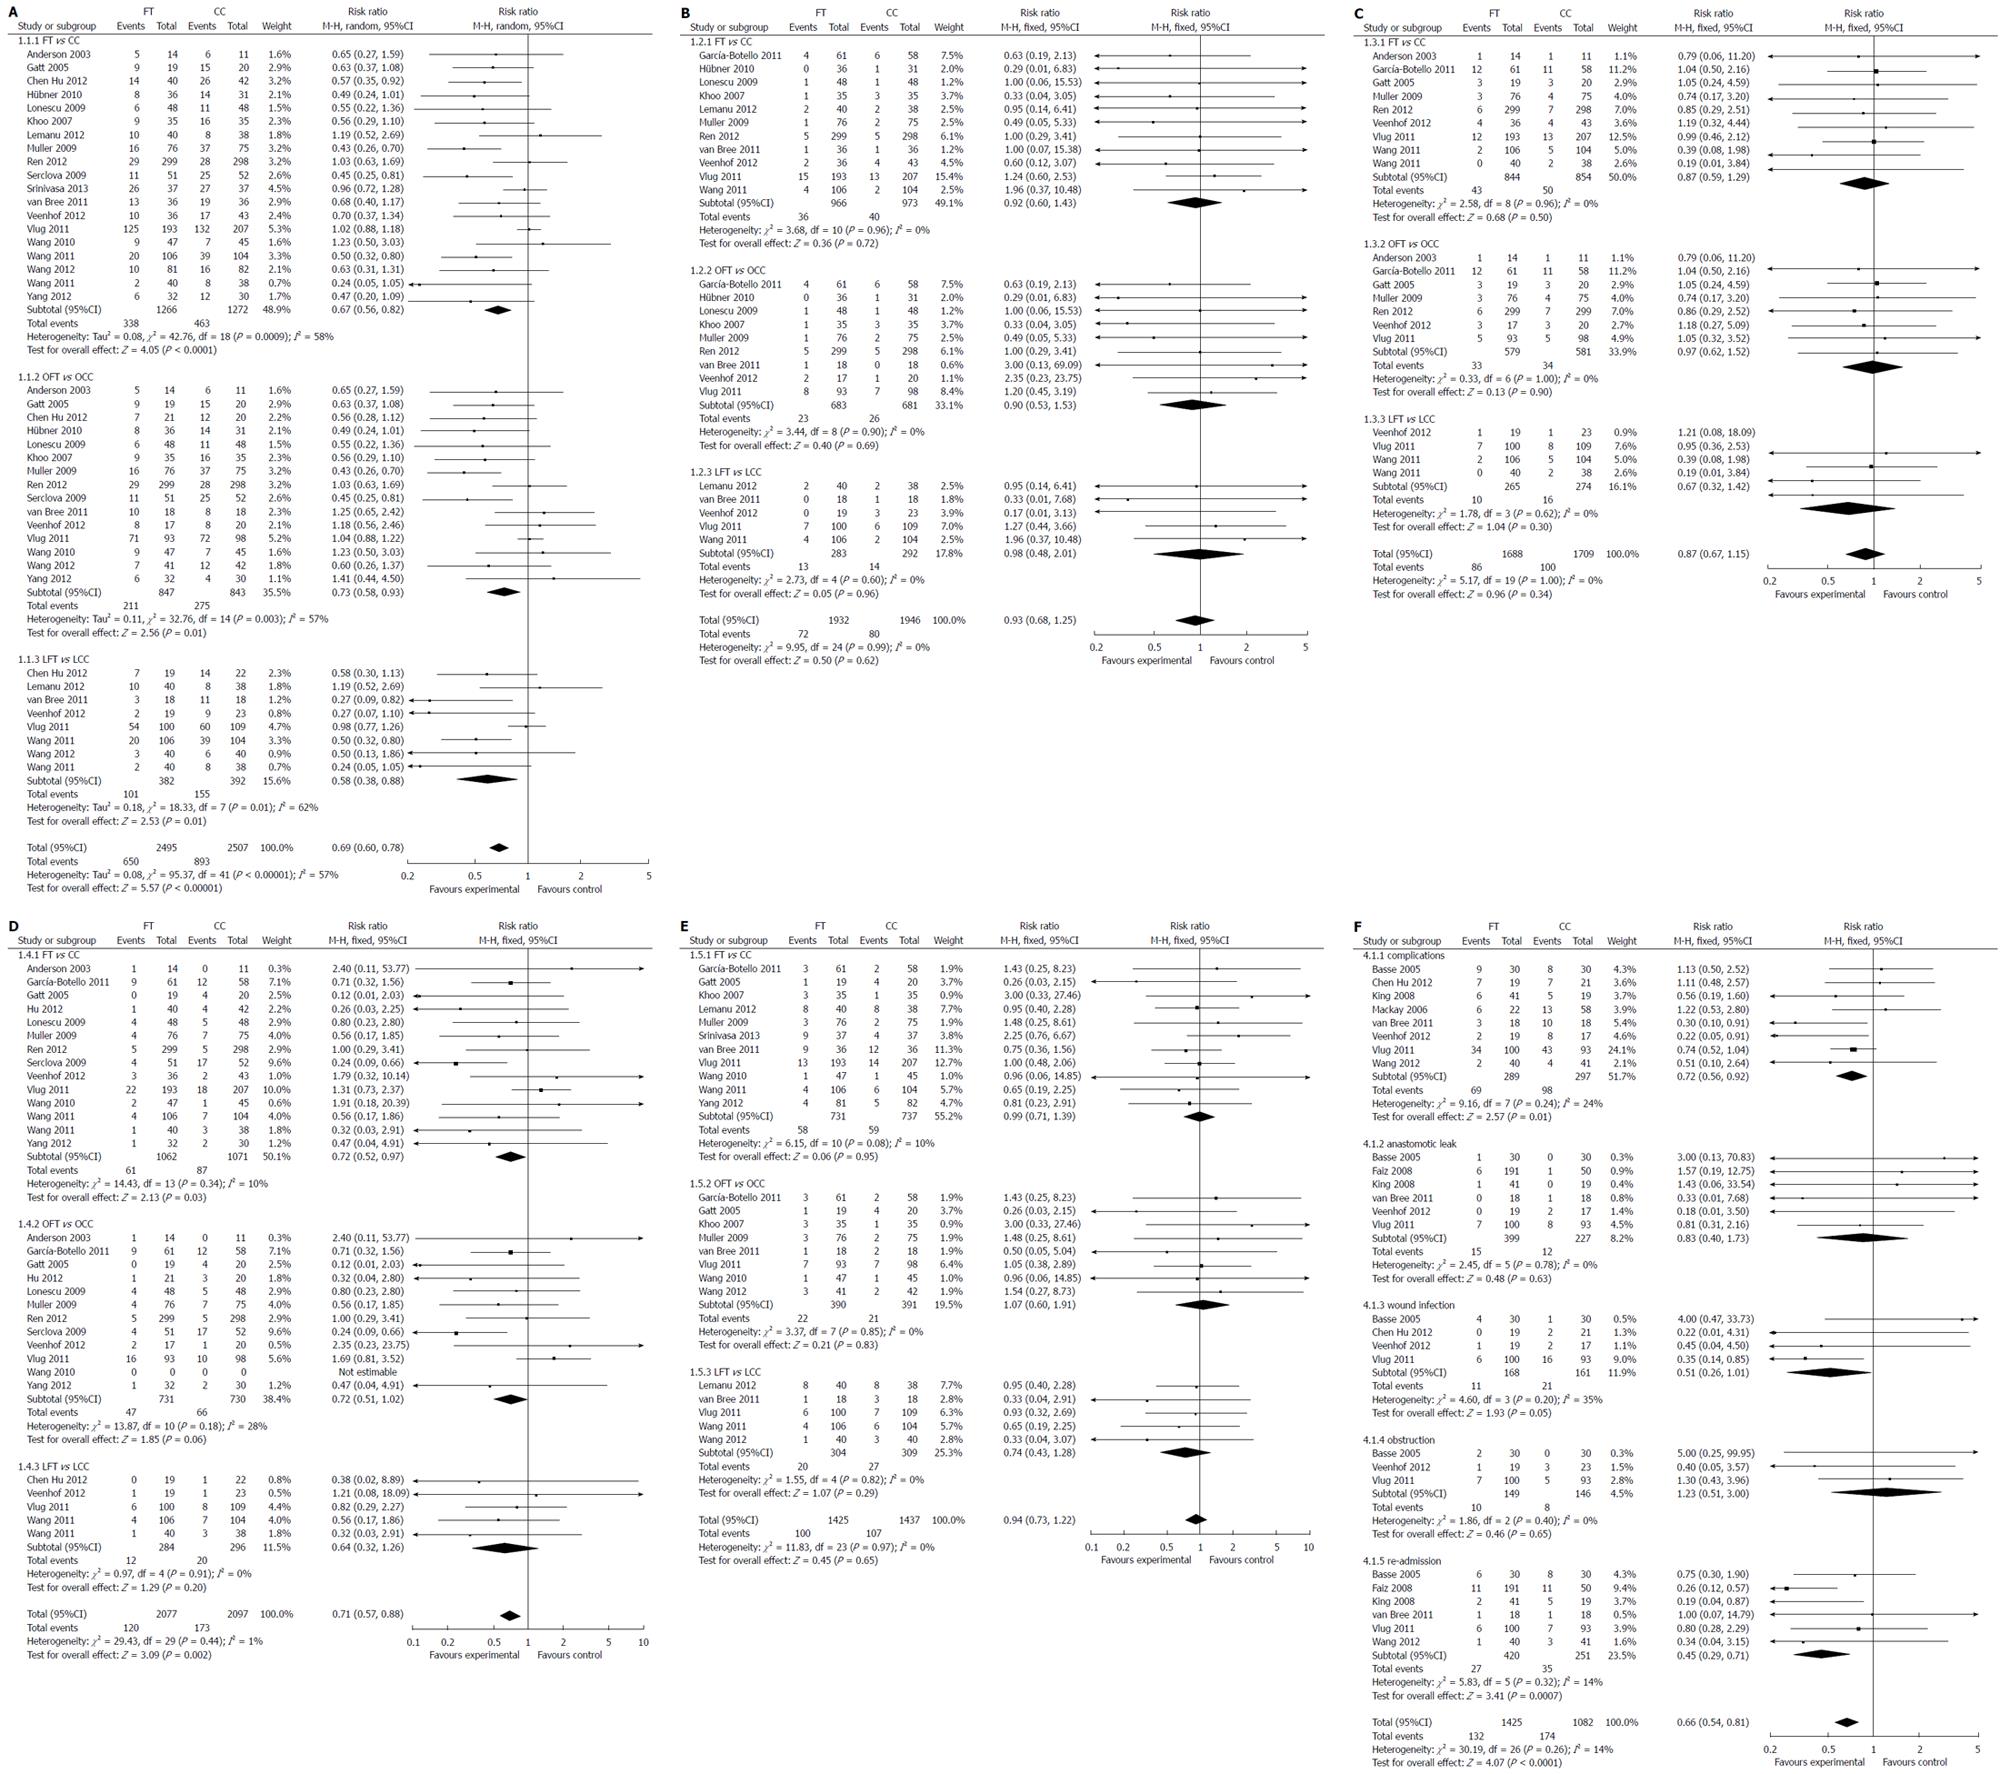
Figure 2 Forest plot of comparison.
A: Complications; B: Anastomotic leak; C: Obstruction; D: Wound infection; E: Re-admission; F: LFT vs OFT. RRs are shown with 95% CIs.
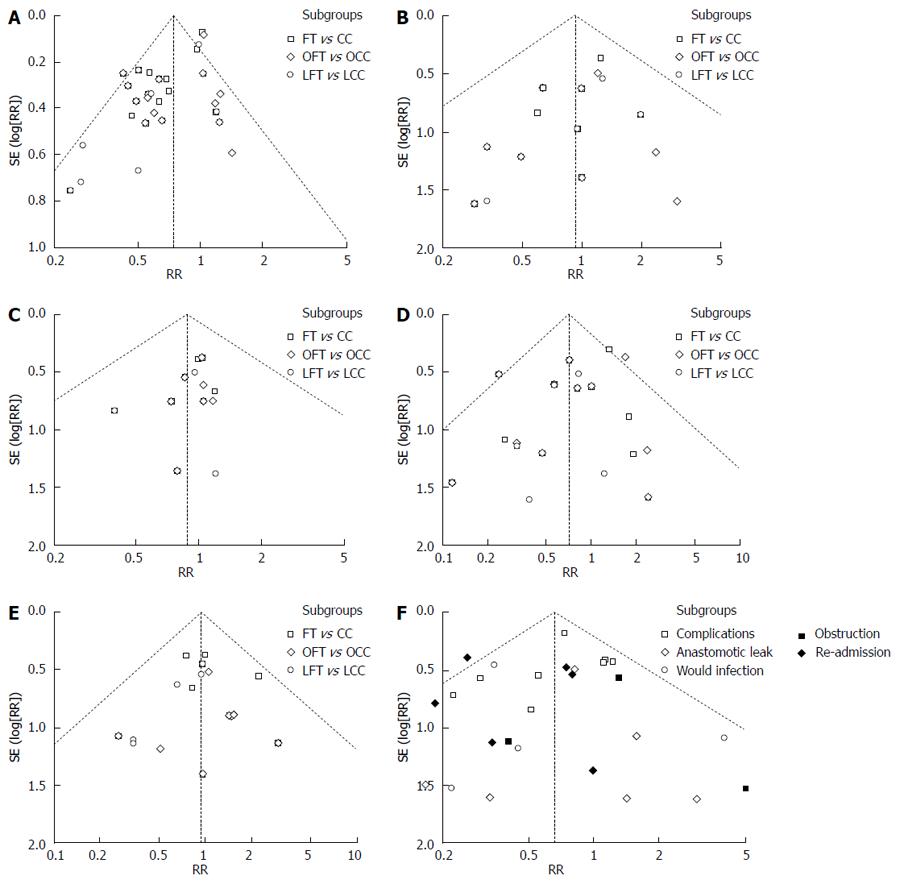
Figure 3 Funnel plot of comparison.
A: Complications; B: Anastomotic leak; C: Obstruction; D: Wound infection; E: Re-admission; F: LFT vs OFT.
- Citation: Wang LH, Fang F, Lu CM, Wang DR, Li P, Fu P. Safety of fast-track rehabilitation after gastrointestinal surgery: Systematic review and meta-analysis. World J Gastroenterol 2014; 20(41): 15423-15439
- URL: https://www.wjgnet.com/1007-9327/full/v20/i41/15423.htm
- DOI: https://dx.doi.org/10.3748/wjg.v20.i41.15423


