Copyright
©2014 Baishideng Publishing Group Co.
World J Gastroenterol. Jan 28, 2014; 20(4): 1107-1113
Published online Jan 28, 2014. doi: 10.3748/wjg.v20.i4.1107
Published online Jan 28, 2014. doi: 10.3748/wjg.v20.i4.1107
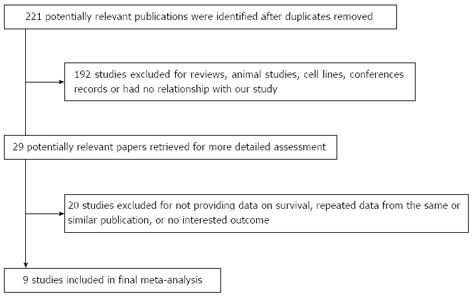
Figure 1 Flow diagram indicating the process of selecting articles for meta-analysis.
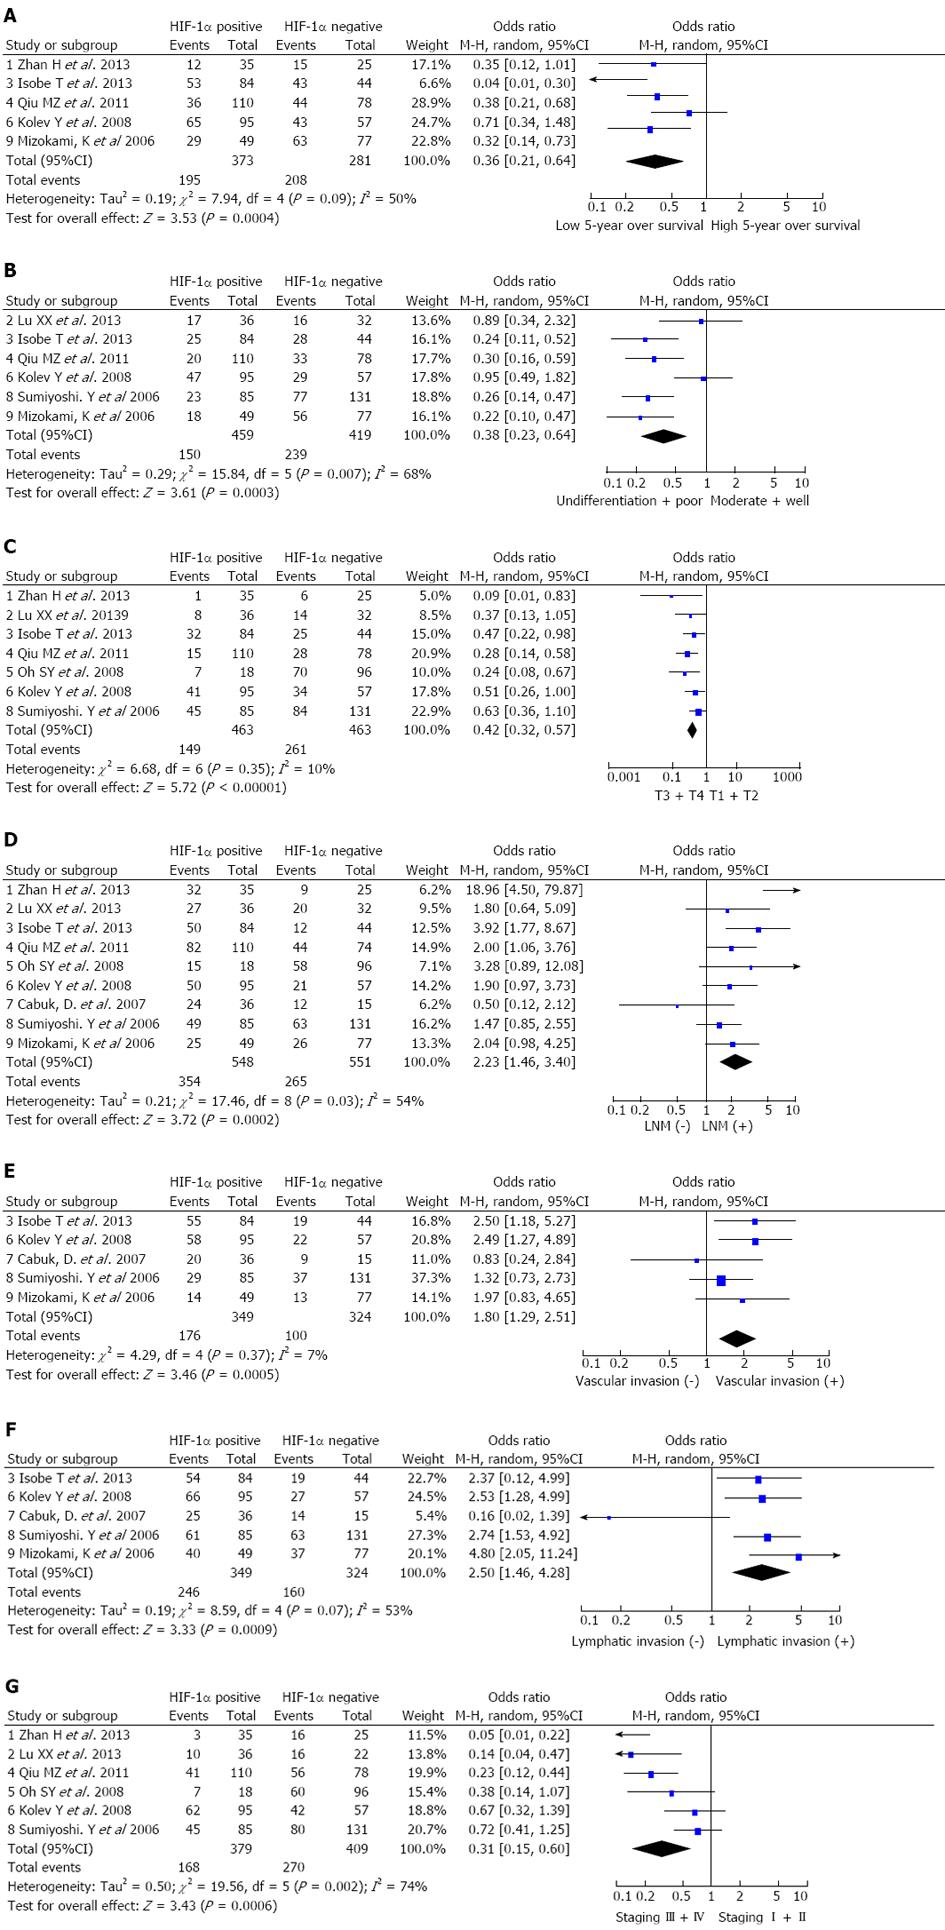
Figure 2 Forest plots.
A: The results of the meta-analysis for 5-year overall survival; B: The results of the meta-analysis for tumor differentiation; C: The results of the meta-analysis for depth of invasion; D: The results of the meta-analysis for lymph node metastasis (LNM); E: The results of the meta-analysis for vascular invasion; F: The results of the meta-analysis for lymphatic invasion; G: The results of the meta-analysis for tumor node metastasis stage.
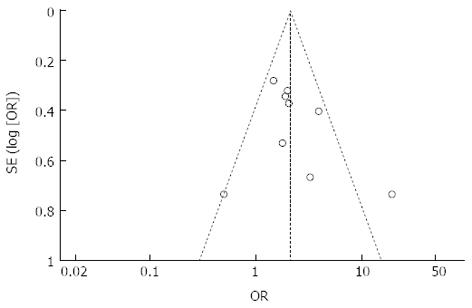
Figure 3 Funnel plot of studies of hypoxia inducible factor-1α positive expression in gastric cancer.
- Citation: Lin S, Ma R, Zheng XY, Yu H, Liang X, Lin H, Cai XJ. Meta-analysis of immunohistochemical expression of hypoxia inducible factor-1α as a prognostic role in gastric cancer. World J Gastroenterol 2014; 20(4): 1107-1113
- URL: https://www.wjgnet.com/1007-9327/full/v20/i4/1107.htm
- DOI: https://dx.doi.org/10.3748/wjg.v20.i4.1107


