Copyright
©2014 Baishideng Publishing Group Inc.
World J Gastroenterol. Sep 21, 2014; 20(35): 12533-12541
Published online Sep 21, 2014. doi: 10.3748/wjg.v20.i35.12533
Published online Sep 21, 2014. doi: 10.3748/wjg.v20.i35.12533
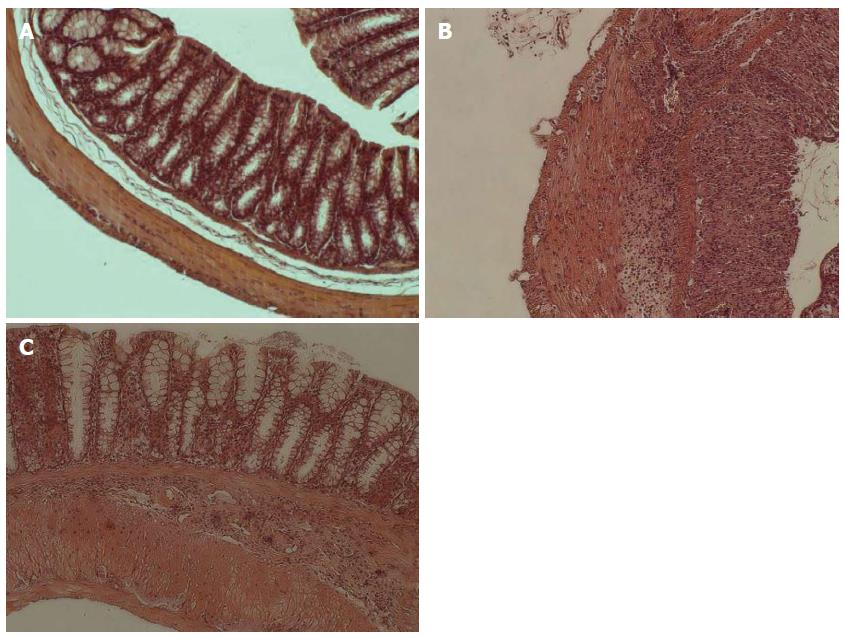
Figure 1 Effect of dextran sulphate sodium treatment on histological parameters in Balb/c mice.
Analysis of histological parameters was performed as described in Materials and Methods (original magnification × 10). A: Untreated mice (n = 12); B: Acute dextran sulphate sodium (DSS)-induced colitis group (oral administration of 3.5% DSS solution for 7 d; n = 8); C: Chronic DSS-induced colitis group (oral administration of 3.5% DSS for 44 d; n = 8).
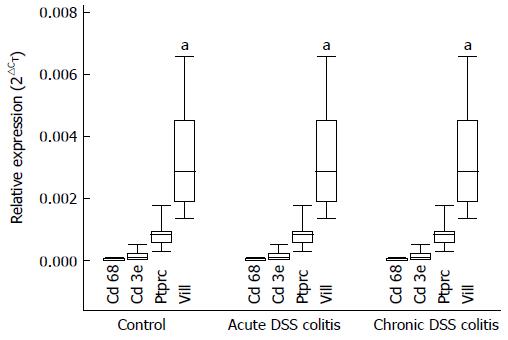
Figure 2 Expression of Cd68, Cd3e, Ptprc, and Vill in the colonic epithelial cells of male Balb/c mice.
Cd68, Cd3e, Ptprc, and Vill were specific cell type markers (Ptprc - a hematopoietic cell marker, Cd3e - a T cell marker, Cd68 - a monocyte/macrophage marker, Vill - an epithelial cells marker). The expression level of genes in the cells was determined by real-time PCR. aStatistically significant differences in expression levels of inflammatory cell markers (Cd68, Cd3e, Ptprc) and epithelial cell specific marker Vill in all the experimental groups. Values are presented as mean ± SE. Control group: n = 12. Both DSS-induced colitis groups: n = 8. aP < 0.05, both DSS-induced colitis groups vs control. DSS: Dextran sulphate sodium.
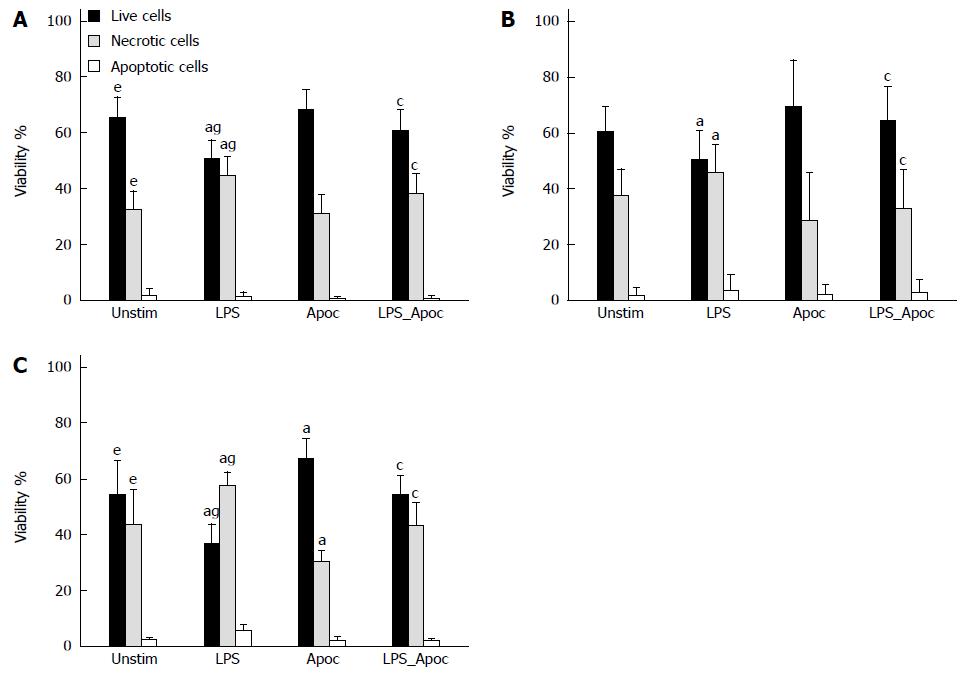
Figure 3 Assessment of viability of mouse colonic epithelial cells.
Cells were incubated with 20 μg/mL LPS, 1 mmol/L apocynin (Apoc), 20 μg/mL LPS + 1 mmol/L Apoc, and without stimulation for 24 h. A: Untreated mice; B: Acute DSS-induced colitis group; C: Chronic DSS-induced colitis group. aP < 0.05, DSS-induced colitis groups untreated vs one of the stimulated subgroups in the control; cP < 0.05, DSS-induced colitis groups vs LPS and LPS + Apoc treated subgroups in the control; eP < 0.05, chronic DSS-induced colitis groups in the untreated subgroup vs control; gP < 0.05, chronic DSS-induced colitis groups in the LPS subgroup vs control; Values are presented as mean ± SE. Untreated mouse group: n = 12. Both DSS-induced colitis groups: n = 8. LPS: Lipopolysaccharide.
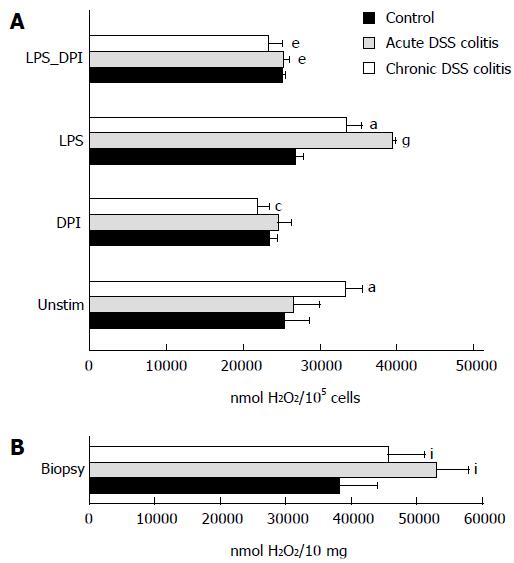
Figure 4 Assessment of hydrogen peroxide production.
A: Mouse colonic epithelial cells were incubated for 30 min with 10 μg/mL LPS, 10 μmol/L DPI, 10 μg/mL LPS + 10 μmol/L DPI or without stimulation; B: Colonic biopsies (10 mg) of DSS-induced colitis mice and control subjects were incubated without stimulation for 30 min. aP < 0.05, DSS-induced colitis groups vs stimulated and un-stimulated cell subgroups within control. cP < 0.05, untreated vs DPI treated subgroups in the chronic DSS-induced colitis group. eP < 0.05, LPS vs LPS + DPI treated cell subgroups in both DSS-induced colitis groups. gP < 0.05, untreated vs LPS treated cell subgroups in the acute DSS-induced colitis group. iP < 0.05, DSS-induced colitis groups in the mouse colonic biopsies vs control. Values are mean ± SE. Untreated mouse group: n = 12. Both DSS-induced colitis groups: n = 8.
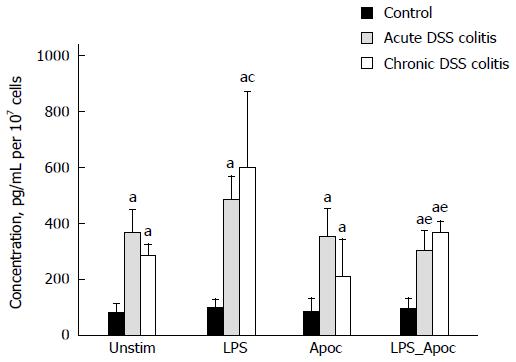
Figure 5 Assessment of TNF-α production by mouse colonic epithelial cells.
TNF-α concentration was measured in cell media after 24 h incubation with 20 μg/mL of LPS, 1 mmol/L of apocynin (Apoc), 20 μg/mL LPS + 1 mmol/L Apoc or without stimulation; aP < 0.05, DSS-induced colitis groups in all subgroups vs control; cP < 0.05, untreated vs LPS treated subgroup in the chronic DSS-induced colitis group; eP < 0.05, LPS vs LPS + apocynin treated subgroup in both DSS-induced colitis groups. Values are presented as mean ± SE. Untreated mouse group: n = 12. Both DSS-induced colitis groups: n = 8.
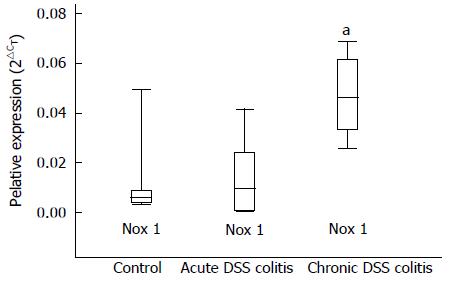
Figure 6 Expression of Nox1 in the colonic epithelial cells of male Balb/c mice.
The expression levels of genes in these cells were determined by real-time PCR. aP < 0.05 chronic DSS-induced colitis group vs both other groups. Values are presented as mean ± SE. Control group: n = 12. Both DSS-induced colitis groups: n = 8. DSS: Dextran sulphate sodium.
- Citation: Ramonaite R, Skieceviciene J, Juzenas S, Salteniene V, Kupcinskas J, Matusevicius P, Borutaite V, Kupcinskas L. Protective action of NADPH oxidase inhibitors and role of NADPH oxidase in pathogenesis of colon inflammation in mice. World J Gastroenterol 2014; 20(35): 12533-12541
- URL: https://www.wjgnet.com/1007-9327/full/v20/i35/12533.htm
- DOI: https://dx.doi.org/10.3748/wjg.v20.i35.12533


