Copyright
©2014 Baishideng Publishing Group Inc.
World J Gastroenterol. Jul 28, 2014; 20(28): 9486-9496
Published online Jul 28, 2014. doi: 10.3748/wjg.v20.i28.9486
Published online Jul 28, 2014. doi: 10.3748/wjg.v20.i28.9486
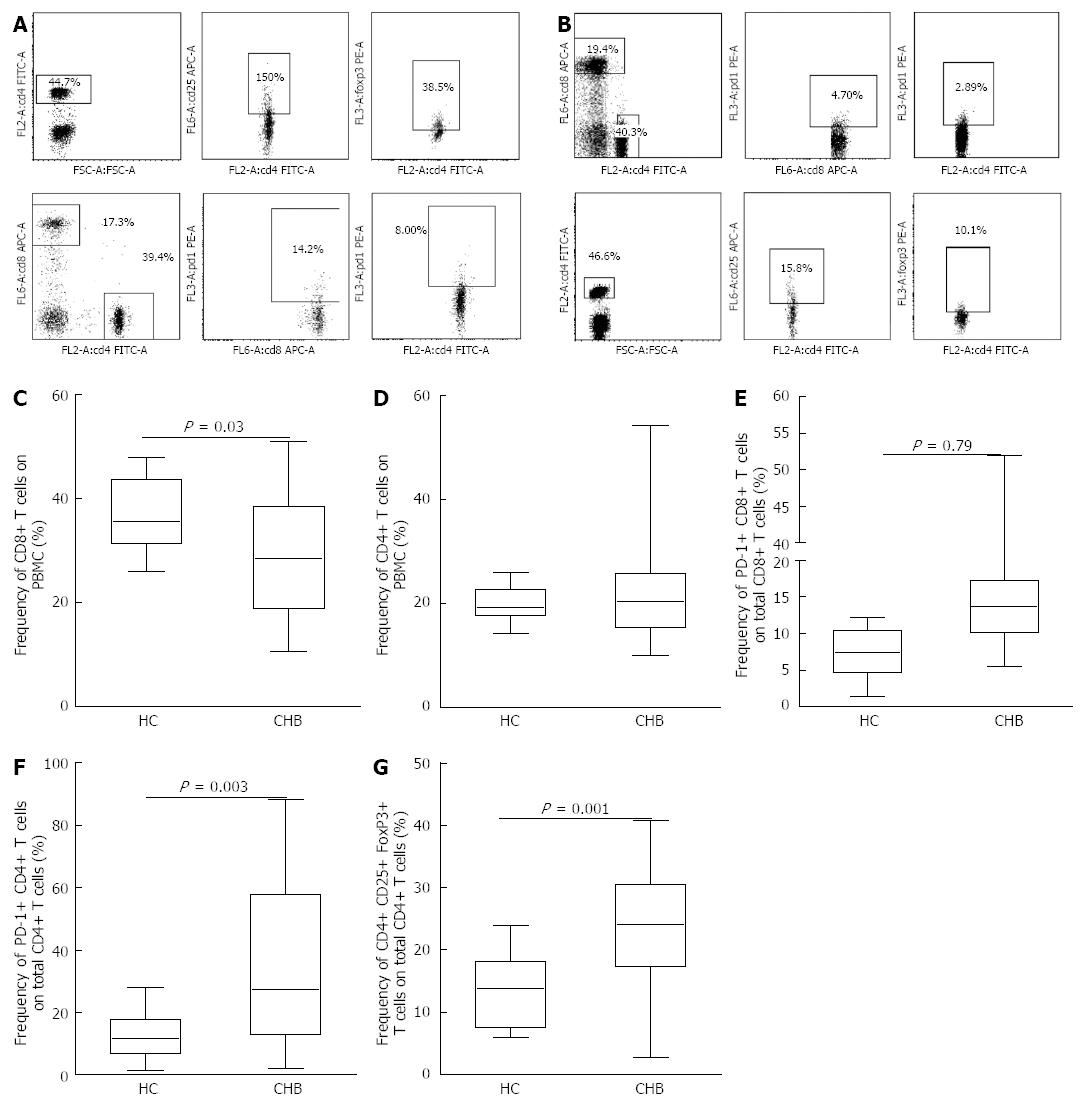
Figure 1 Pretreatment cellular phenotype of patients with chronic hepatitis B.
A: Representative dot plots of CD4, CD8, programmed death-1 (PD-1) and FoxP3 staining in chronic hepatitis B (CHB) patients; B: Representative dot plots of CD4, CD8, PD-1 and FoxP3 staining in healthy controls (HCs); C: Peripheral frequency of CD8+ T cells in the CHB patients and HCs; D: Peripheral frequency of CD4+ T cells in the CHB patients and HCs; E: Peripheral frequency of PD-1+ CD8 T cells of the total CD8 T cells in CHB patients and HCs (P = 0.0001); F: Peripheral frequency of PD-1+ CD4 T cells of the total CD4 T cells in CHB patients and HCs; G: Frequency of circulating CD4+CD25+FoxP3+ T cells (FoxP3+ Treg) in the CHB patients and HCs. PBMC: Peripheral blood mononuclear cell.
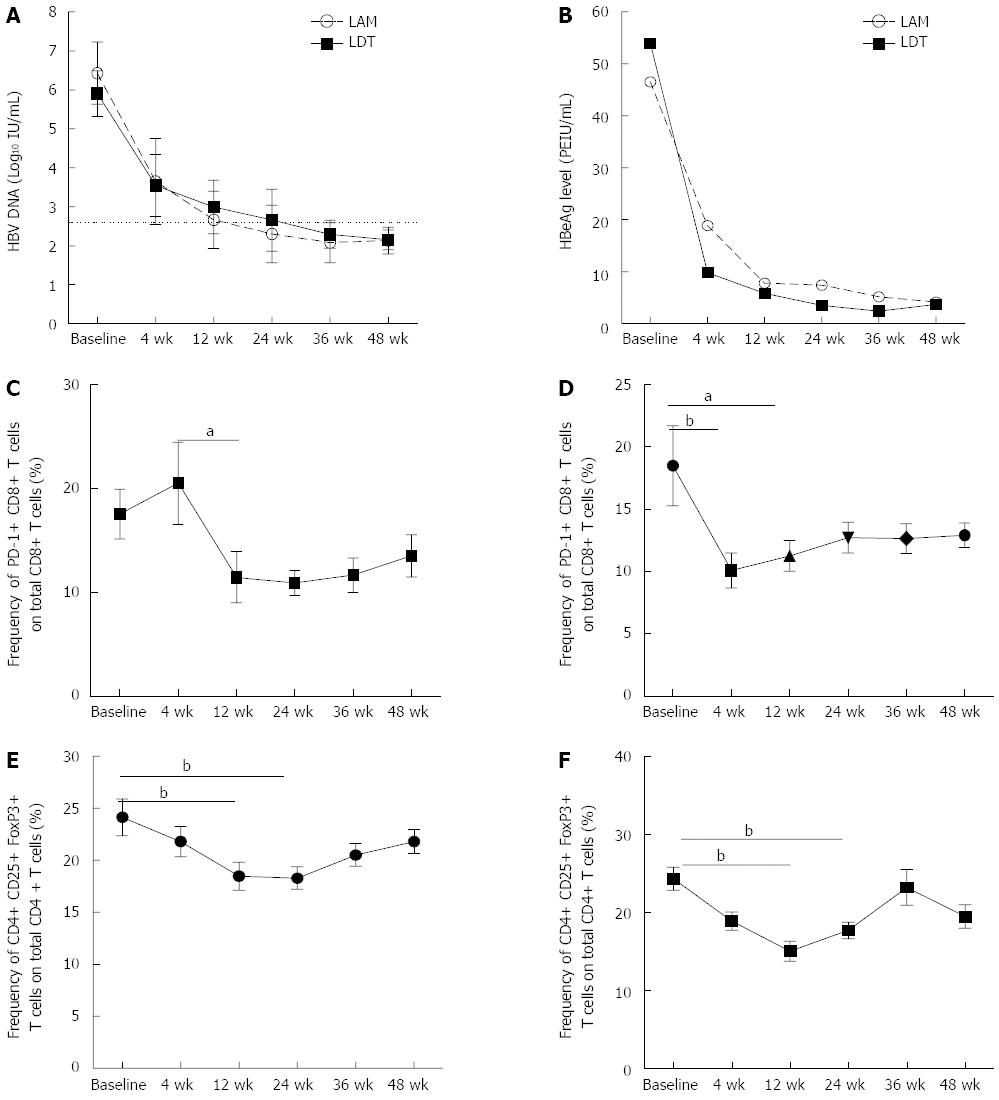
Figure 2 Suppression of hepatitis B virus deoxyribonucleic acid and hepatitis B envelope antigen levels and the expansion of programmed death 1 positive CD8 T cells and CD4+ CD25+ FoxP3+ T regulatory cells.
A, B: In patients treated with either lamivudine (LAM) or telbivudine (LDT), the hepatitis B virus (HBV) DNA and hepatitis B envelope antigen (HBeAg) levels decreased significantly compared to the baseline; C: In the LAM group, a significant decrease in the peripheral frequency of programmed death 1 positive CD8 T (PD-1+ CD8 T) cells was observed at treatment week 12; D: In the LDT group, the frequency of PD-1+ CD8 T cells significantly decreased at both week 4 and week 12 compared to the baseline; E and F: In both the LAM group (E) and LDT group (F), a significant decrease in the frequency of T regulatory cells was observed at weeks 12 and 24 compared to the baseline. aP < 0.05; bP < 0.01. HBV DNA: Hepatitis B virus deoxyribonucleic acid.
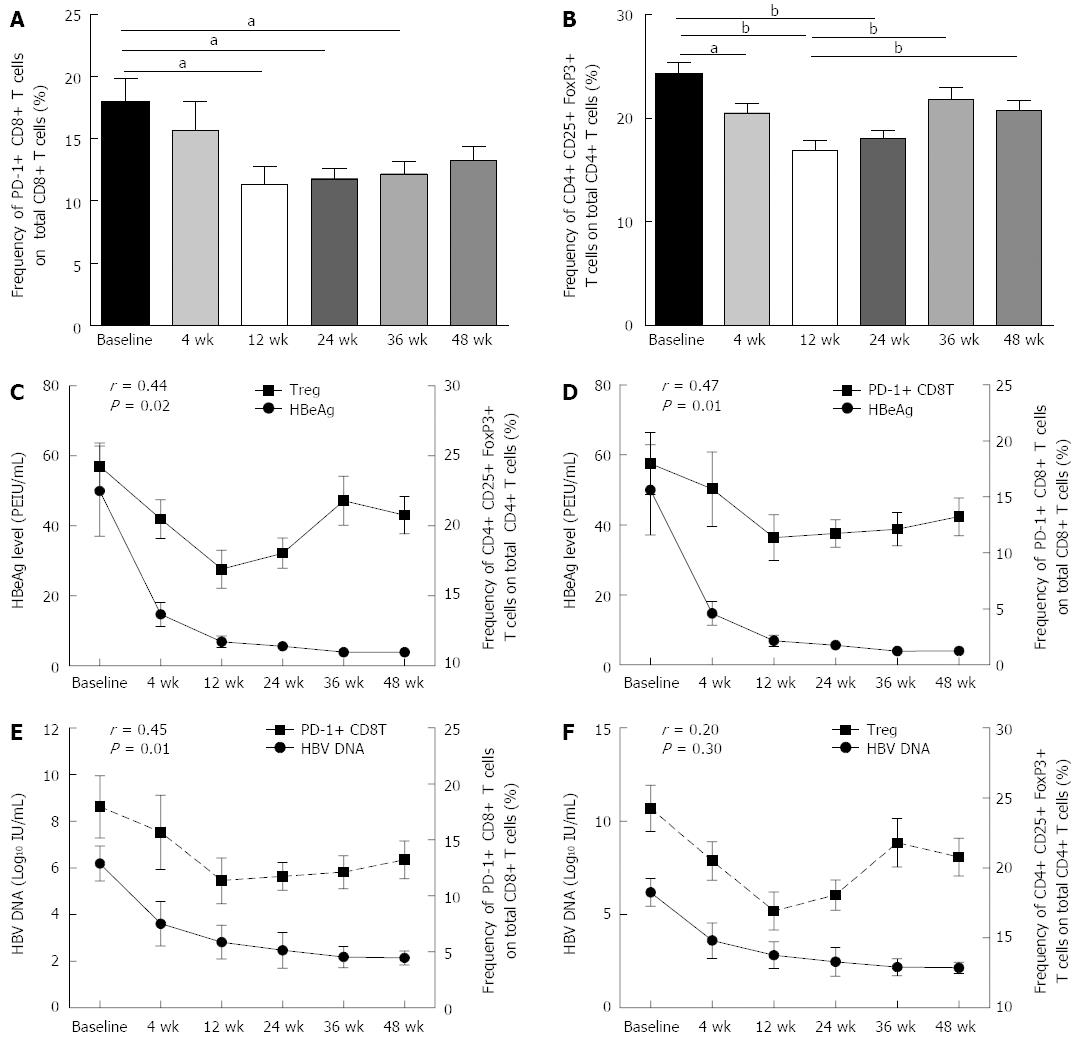
Figure 3 The relationship between the peripheral frequency of CD4+CD25+FoxP3+ T regulatory cells or programmed death 1 positive CD8 T cells and hepatitis B virus DNA or hepatitis B envelope antigen at different time points during therapy.
A: Peripheral frequency of programmed death 1 positive CD8 T (PD-1+ CD8 T) cells in all chronic hepatitis B (CHB) patients at different points during therapy; B: Peripheral frequency of T regulatory cell (Treg) in all CHB patients at different points during therapy; C: Relationship between the HBeAg level and the peripheral frequency of Treg cells in all CHB patients during therapy; D: Relationship between the HBeAg level and the peripheral frequency of PD-1+ CD8 T cells in all CHB patients during therapy; E: Relationship between the hepatitis B virus (HBV) DNA level and the peripheral frequency of PD-1+ CD8 T cells in all CHB patients during therapy; F: Relationship between the HBV DNA level and the peripheral frequency of Treg cells in all CHB patients during therapy. The X-axis shows the different time points during treatment, the left Y-axis shows the HBV DNA or HBeAg levels, and the right Y-axis shows the frequency of Treg cells or PD-1+ CD8 T cells. In the CHB patients, the HBeAg and HBV DNA levels start declining after treatment week 4, along with a decline in FoxP3+ Treg and PD-1+ CD8 T cells. aP < 0.05; bP < 0.01.
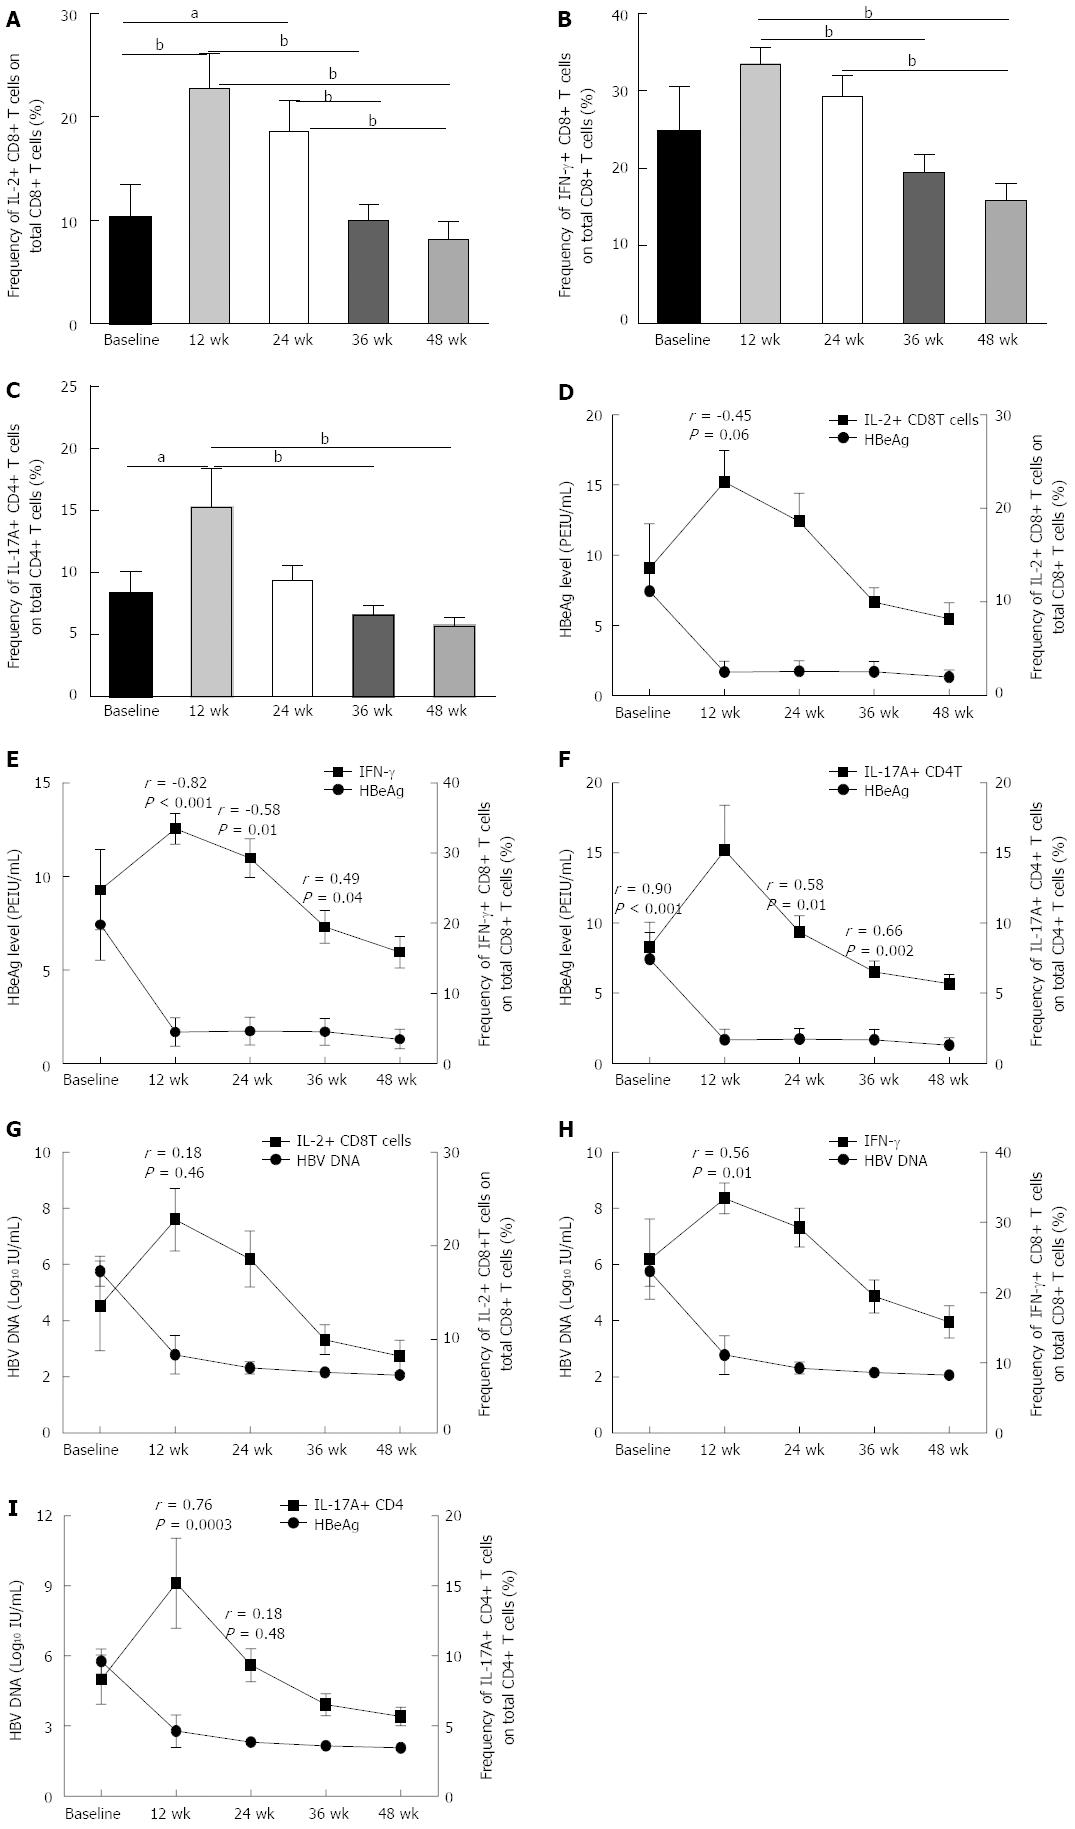
Figure 4 Correlations between viral infection parameters and the frequency of pro-inflammatory cytokine-secreting T cells in chronic hepatitis B patients on nucleoside analogue therapy.
The frequency of pro-inflammatory cytokine-secreting T cells increased significantly at treatment weeks 12 and 24. A: Frequency of interleukin-2 positive CD8 T cells (IL-2+ CD8 T); B: Frequency of interferon-gamma positive CD8 T cells (IFN-γ+ CD8 T); C: Frequency of interleukin-17A positive CD4 T cells (IL-17A+ CD4 T); D: Correlation between the hepatitis B envelope antigen (HBeAg) level and the frequency of IL-2+ CD8 T cells; E: Correlation between the HBeAg level and the frequency of IFN-γ+ CD8 T cells; F: Correlation between the HBeAg level and the frequency of IL-17A+ CD4 T cells; G: Correlation between the HBV DNA level and the frequency of IL-2+ CD8 T cells; H: Correlation between the HBV DNA level and the frequency of IFN-γ+CD8 T cells; I: Correlation between the HBV DNA level and the frequency of IL-17A+ CD4 T cells. aP < 0.05; bP < 0.01.
- Citation: Li CZ, Hu JJ, Xue JY, Yin W, Liu YY, Fan WH, Xu H, Liang XS. Viral infection parameters not nucleoside analogue itself correlates with host immunity in nucleoside analogue therapy for chronic hepatitis B. World J Gastroenterol 2014; 20(28): 9486-9496
- URL: https://www.wjgnet.com/1007-9327/full/v20/i28/9486.htm
- DOI: https://dx.doi.org/10.3748/wjg.v20.i28.9486


