Copyright
©2014 Baishideng Publishing Group Inc.
World J Gastroenterol. Jun 14, 2014; 20(22): 6884-6896
Published online Jun 14, 2014. doi: 10.3748/wjg.v20.i22.6884
Published online Jun 14, 2014. doi: 10.3748/wjg.v20.i22.6884
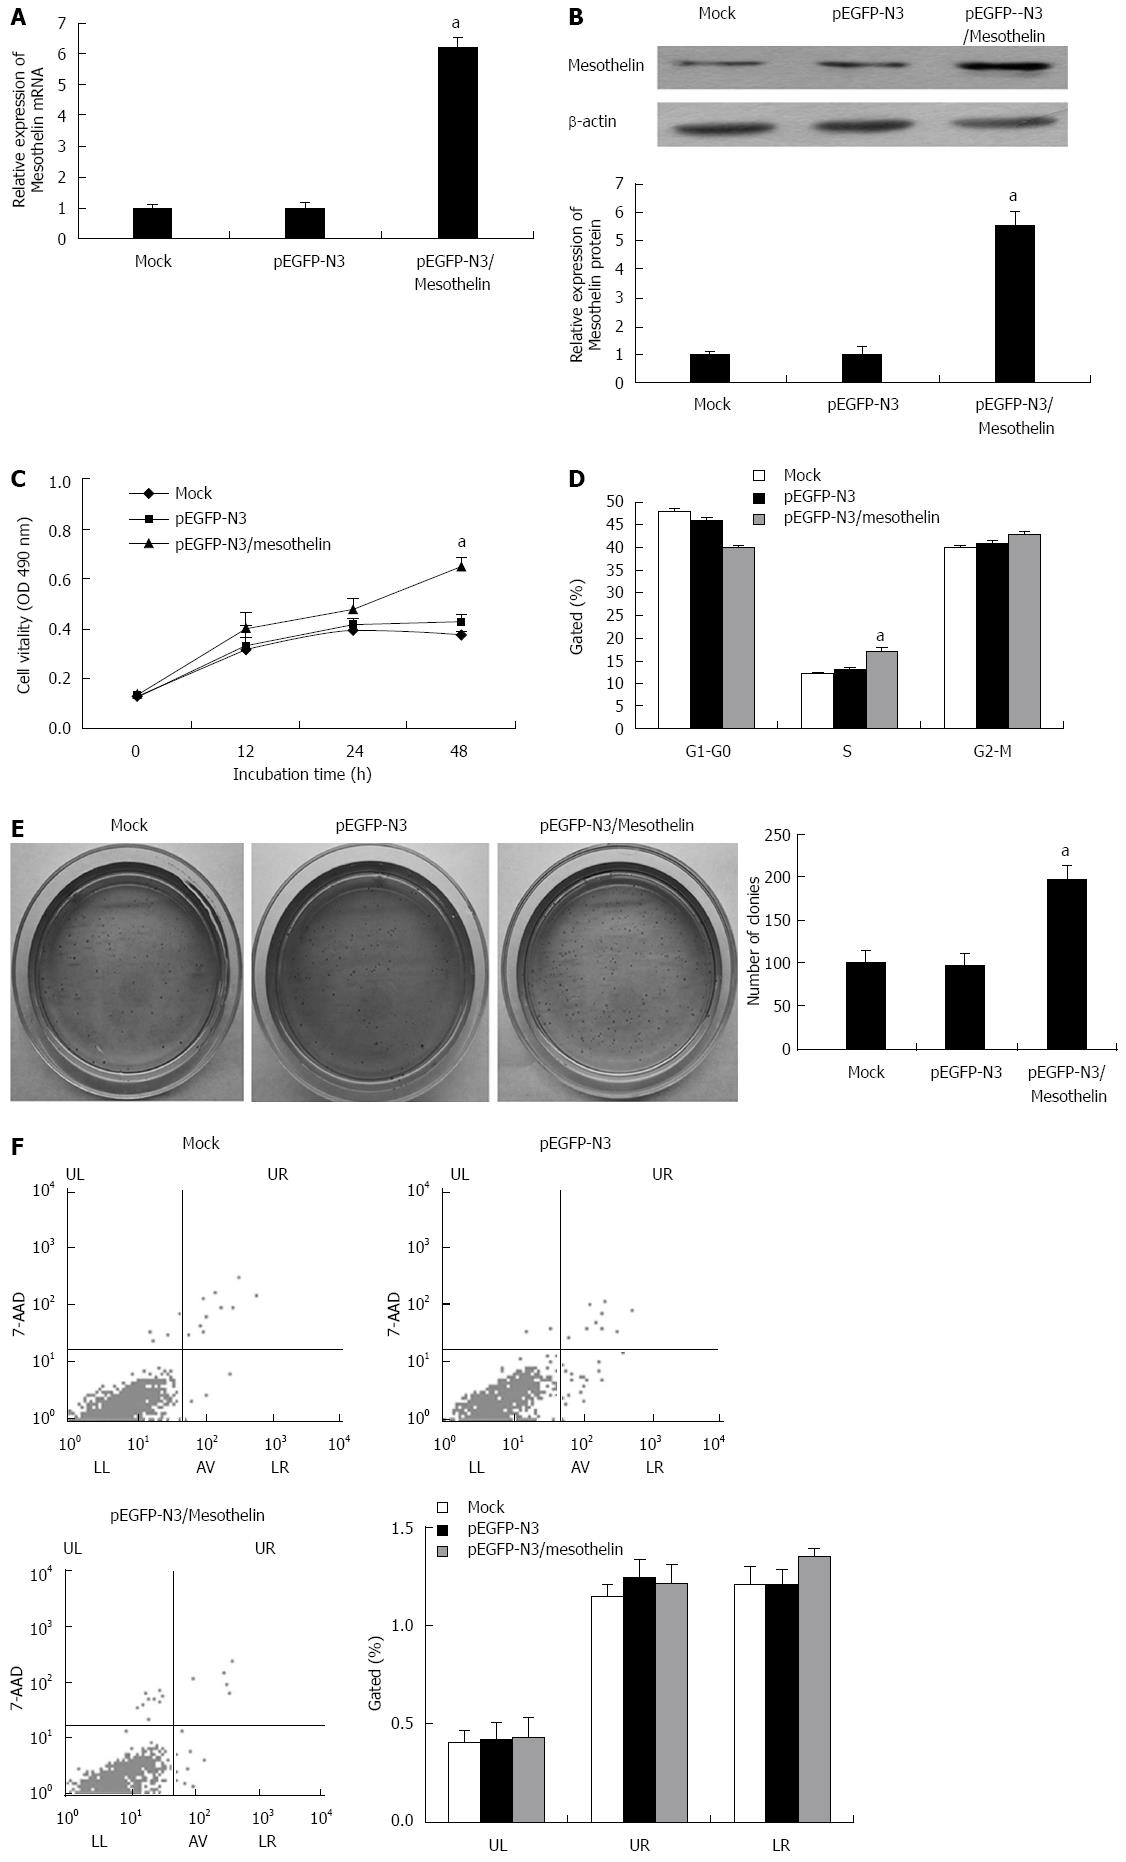
Figure 1 Overexpression of mesothelin in INS-1 cells.
Real-time polymerase chain reaction assay (A) and western blot assay (B) of mesothelin in INS-1 cells transfected with pEGFP-N3 and pEGFP-N3/mesothelin; C: 3-(4,5-dimethylthiazol-2-yl)-2,5-diphenyltetrazolium bromide assays were conducted 48 h after transfection to determine the proliferation of INS-1 cells; D: Bar chart represents the percentage of cells in G0-G1, S, or G2-M phase, as indicated; E: Colony-forming growth assays were conducted to determine the proliferation of INS-1 cells; assays were quantified by spectrophotometer at O.D. 450; F: Apoptotic rates of cells were detected by flow cytometry. Values are expressed as the mean ± SD from three experiments. aP < 0.05 vs mock group. UL: Necrotic cells; UR: Terminal apoptotic cells; LR: Early apoptotic cells.
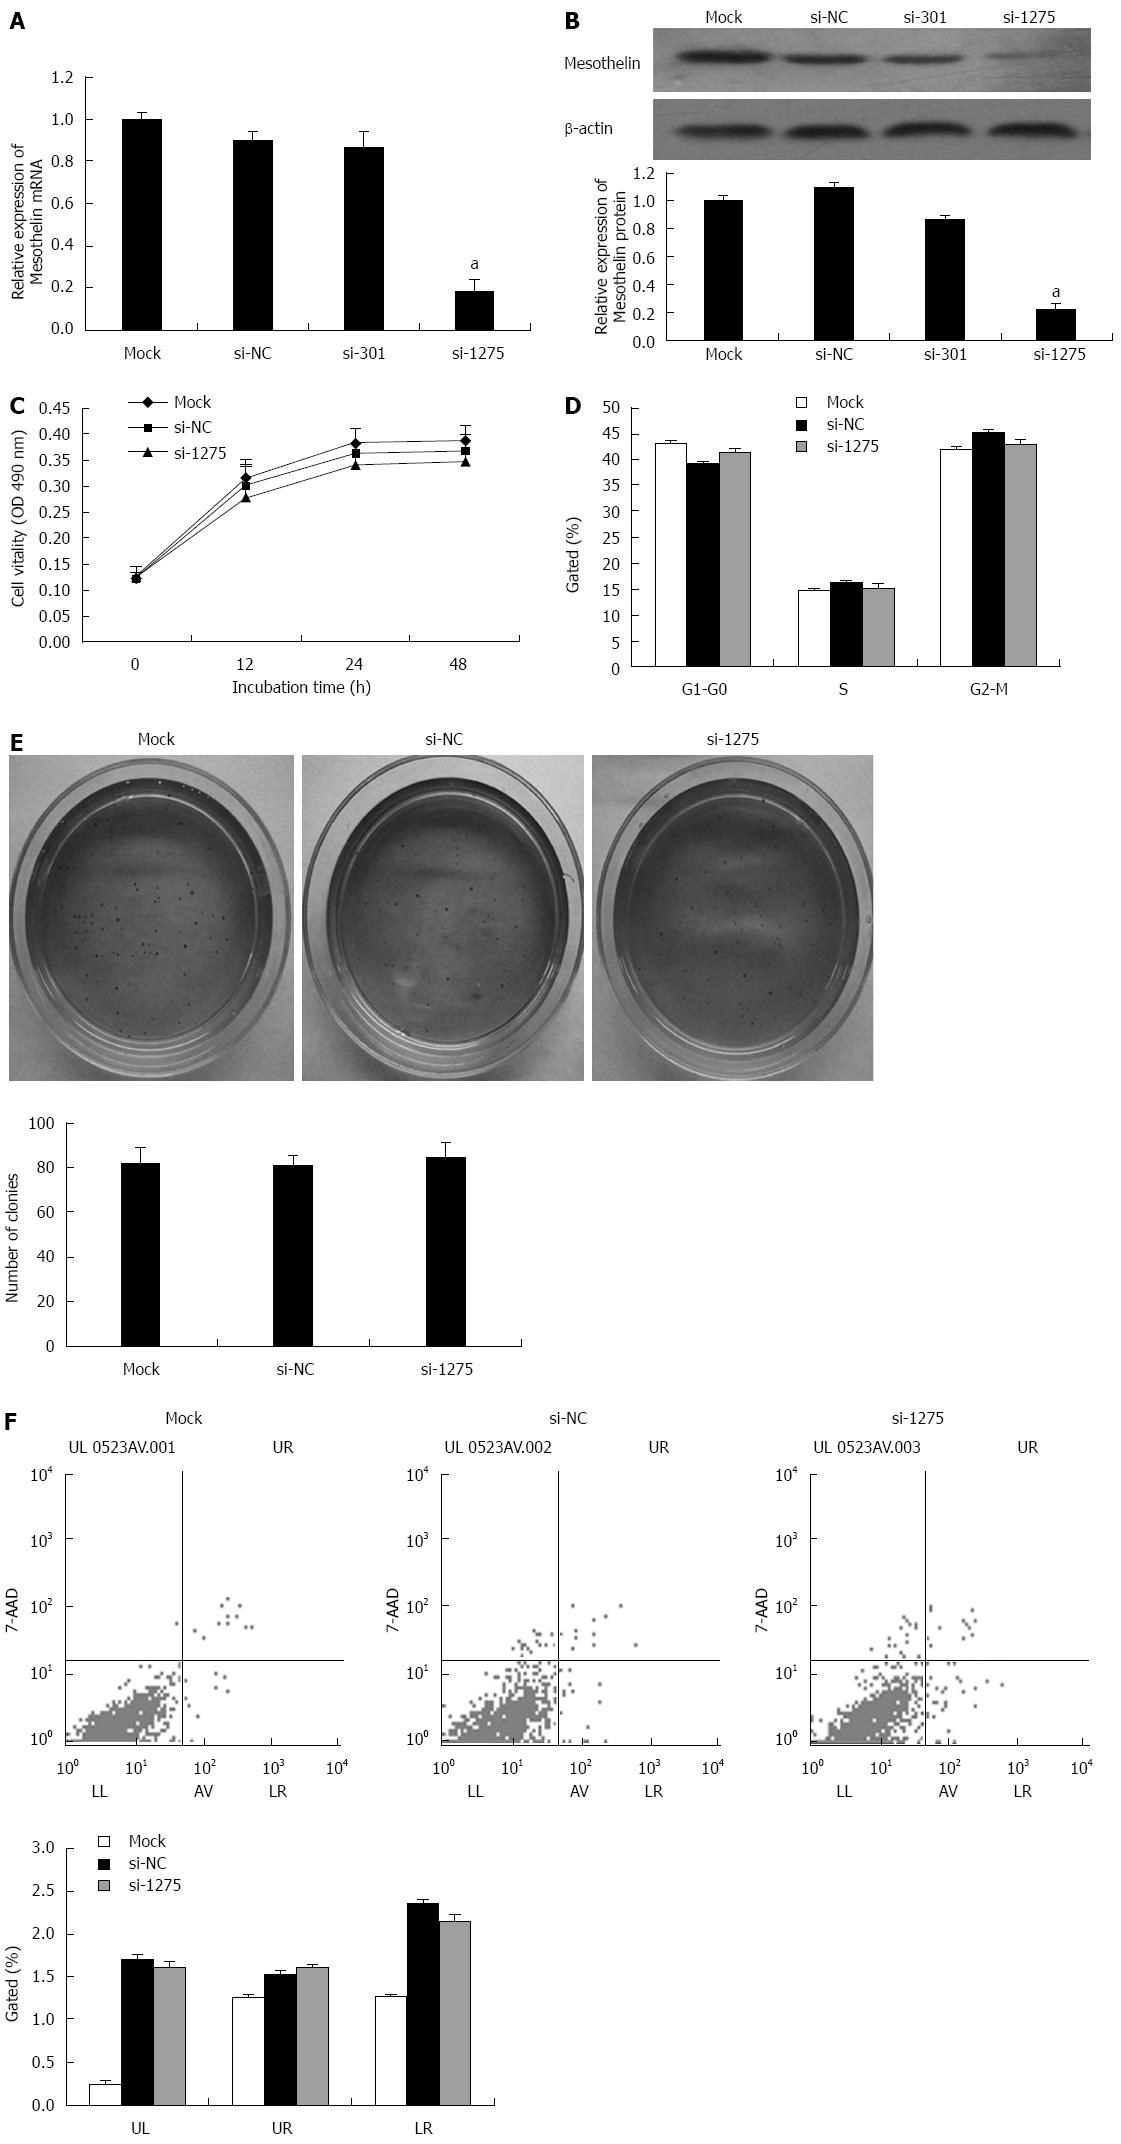
Figure 2 Mesothelin knockdown in INS-1 cells.
Real-time polymerase chain reaction (PCR) assay (A) and western blot assay (B) of mesothelin in INS-1 cells transfected with pcDNA6.2-GW/EmGFP-miR, pcDNA6.2-GW/EmGFP-miR-mesothelin (301), or pcDNA6.2-GW/EmGFP-miR-mesothelin (1275). The qPCR data are normalized against GAPDH; C: 3-(4,5-dimethylthiazol-2-yl)-2,5-diphenyltetrazolium bromide assays were conducted to determine the proliferation of INS-1 cells; D: Bar chart represents the percentage of cells in G0-G1, S, or G2-M phase, as indicated; E: Colony-forming growth assays were conducted to determine the proliferation of INS-1 cells and were quantified by spectrophotometer at O.D.450; F: Apoptotic rates of cells were detected by flow cytometry. Values are expressed as the mean ± SD from three experiments. aP < 0.05 vs mock group. UL: Necrotic cells; UR: Terminal apoptotic cells; LR: Early apoptotic cells.
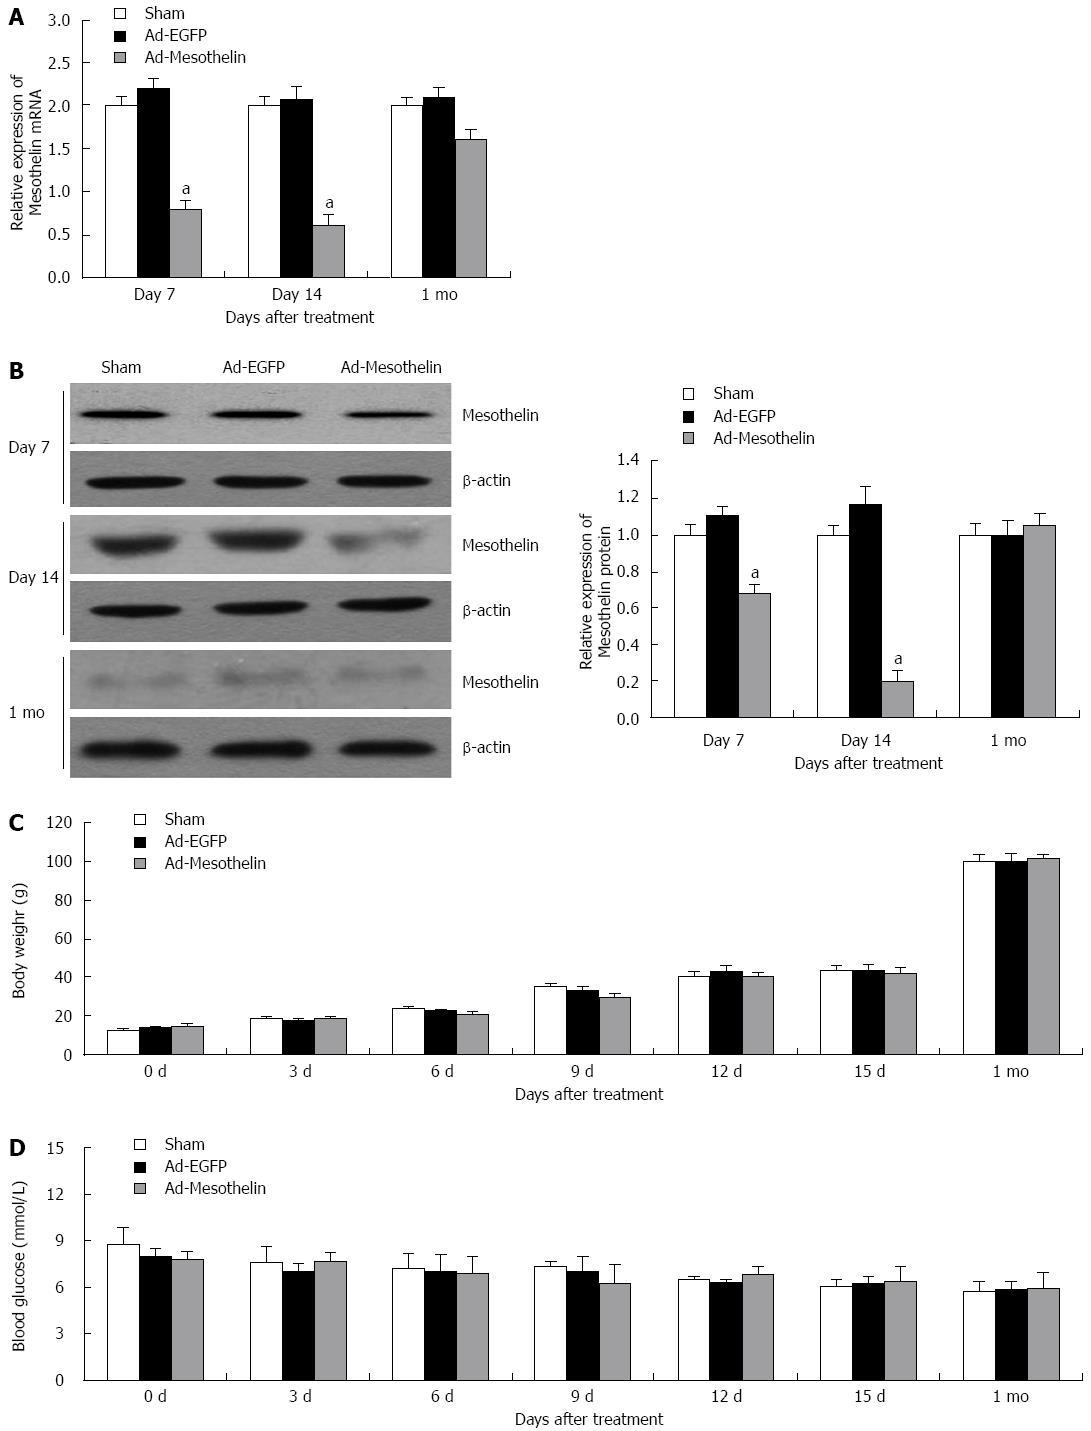
Figure 3 Adenovirus-mediated downregulation of mesothelin in neonatal rat pancreas.
Real-time polymerase chain reaction (PCR) (A) and western blotting (B) assays show the relative expression of mesothelin in the day 7, day 14 and 1 mo rat pancreas after adenovirus injection. Body weight (C) and blood glucose (D) in the sham, Ad-EGFP and Ad-mesothelin did not differ between the three groups. The qPCR data are normalized to18S. Values are expressed as the mean ± SD from three experiments (n = 3 litters; 18 animals). aP < 0.05 vs Ad-EGFP group.
Figure 4 Islet number and cell proliferation of neonatal rats injected with Ad-mesothelin.
Immunofluorescence showed the colocalization of insulin and glucagons. Pancreatic sections were immunostained with anti-insulin antibody (green) and anti-glucagon antibody (red). A histogram showed the distribution of islets (including small islets) on day 7 (A), day 14 (B) and 1 mo (C) after injection. Original magnification, × 100; D: Immunochemistry showed the expression of PCNA in islets on day 7, day 14 and 1 mo. Original magnification, × 200. Values are expressed as the mean ± SD from three experiments. aP < 0.05 vs Ad-EGFP group.
- Citation: Yin DD, You LH, Yuan QX, Liang XD, Wang N, Wang LT, Yuan L, Wang KM, De W. Mesothelin promotes cell proliferation in the remodeling of neonatal rat pancreas. World J Gastroenterol 2014; 20(22): 6884-6896
- URL: https://www.wjgnet.com/1007-9327/full/v20/i22/6884.htm
- DOI: https://dx.doi.org/10.3748/wjg.v20.i22.6884


