Copyright
©2014 Baishideng Publishing Group Inc.
World J Gastroenterol. May 21, 2014; 20(19): 5903-5911
Published online May 21, 2014. doi: 10.3748/wjg.v20.i19.5903
Published online May 21, 2014. doi: 10.3748/wjg.v20.i19.5903
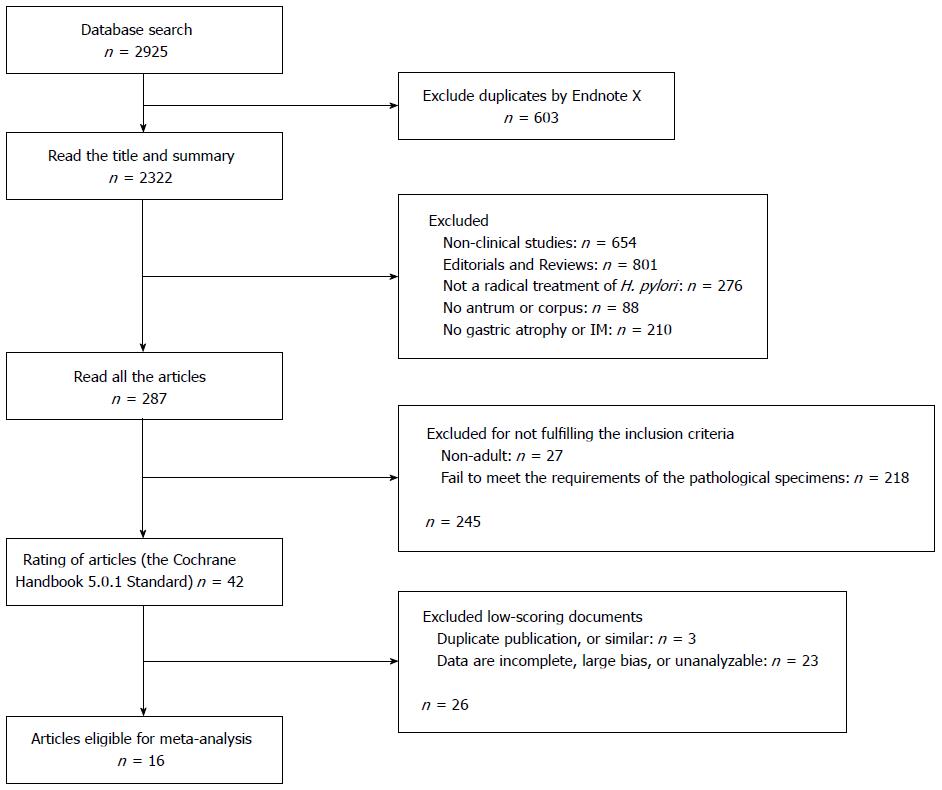
Figure 1 Flow diagram of the selection of included studies.
H. pylori: Helicobacter pylori; IM: Intestinal metaplasia.
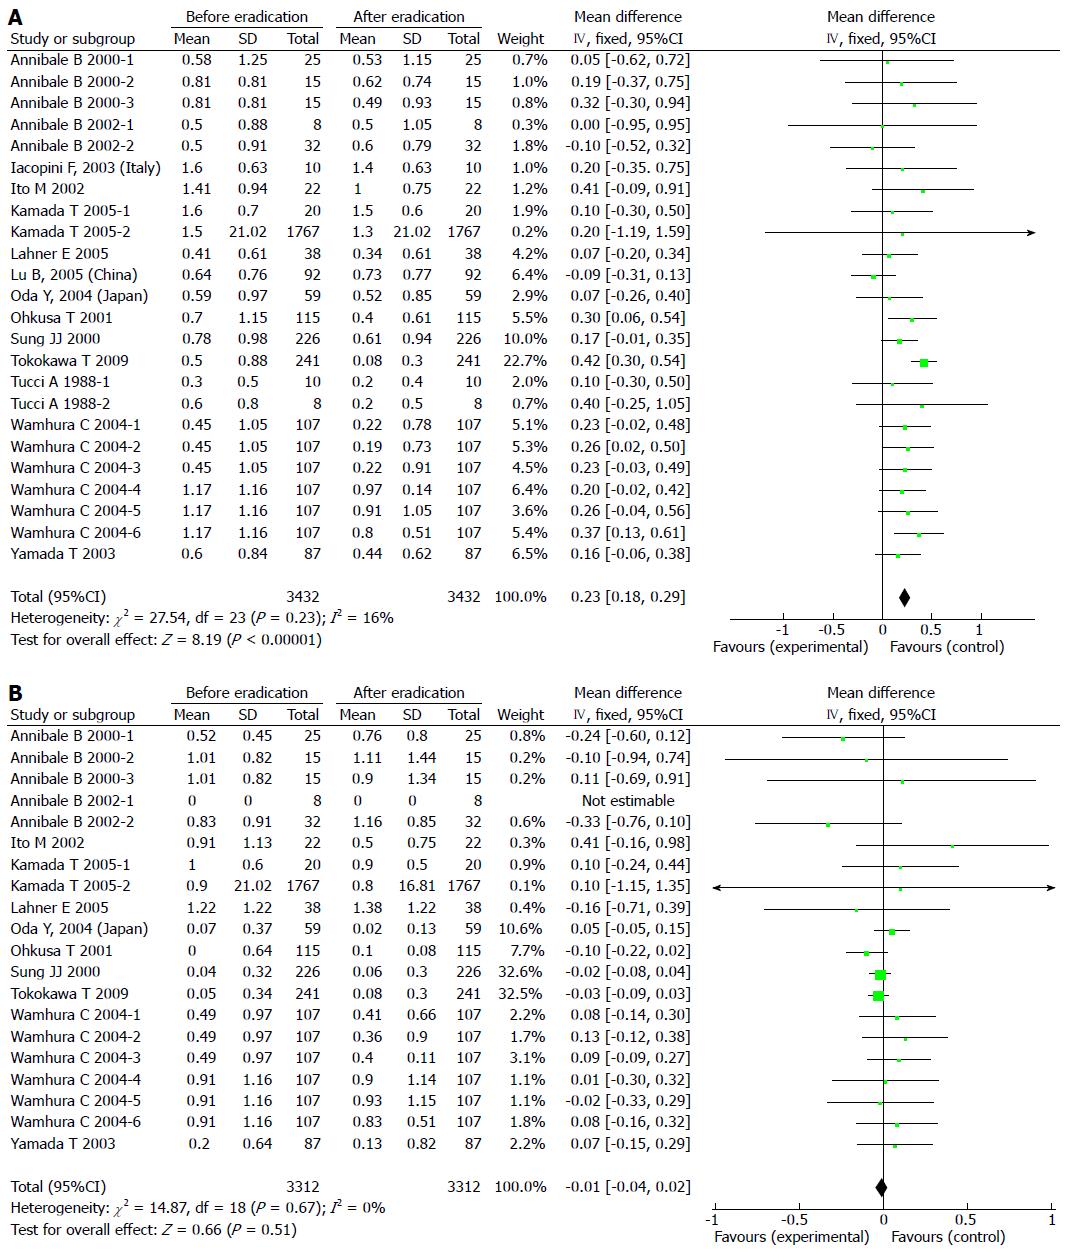
Figure 2 Forest plot comparing intestinal metaplasia in the antrum (A) and the corpus (B).
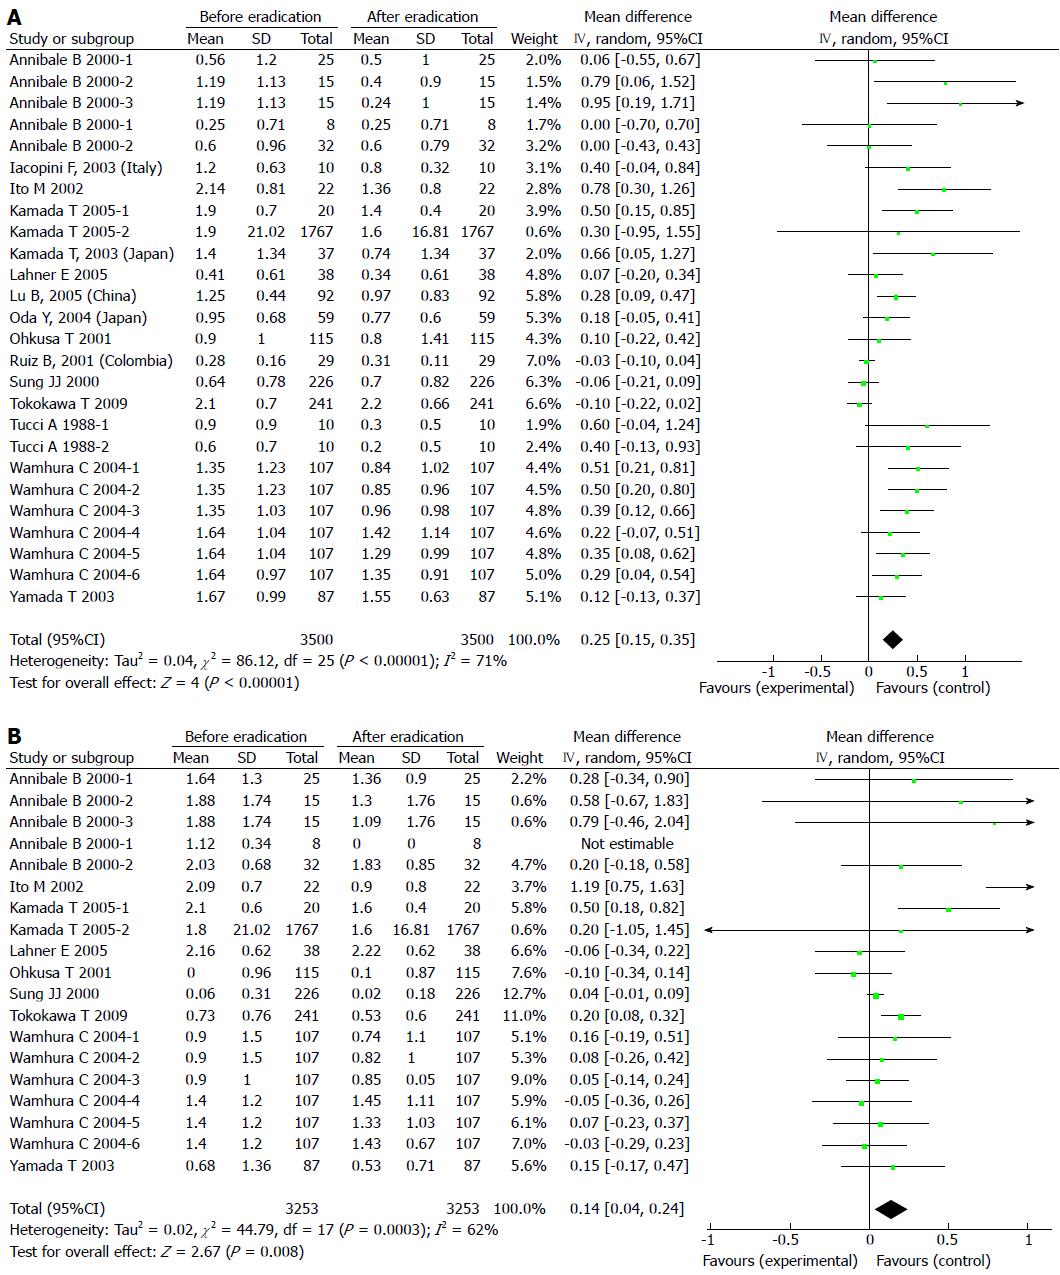
Figure 3 Forest plot comparing gastric atrophy in the antrum (A) and the corpus (B).
-
Citation: Kong YJ, Yi HG, Dai JC, Wei MX. Histological changes of gastric mucosa after
Helicobacter pylori eradication: A systematic review and meta-analysis. World J Gastroenterol 2014; 20(19): 5903-5911 - URL: https://www.wjgnet.com/1007-9327/full/v20/i19/5903.htm
- DOI: https://dx.doi.org/10.3748/wjg.v20.i19.5903


