Copyright
©2014 Baishideng Publishing Group Co.
World J Gastroenterol. May 14, 2014; 20(18): 5474-5482
Published online May 14, 2014. doi: 10.3748/wjg.v20.i18.5474
Published online May 14, 2014. doi: 10.3748/wjg.v20.i18.5474
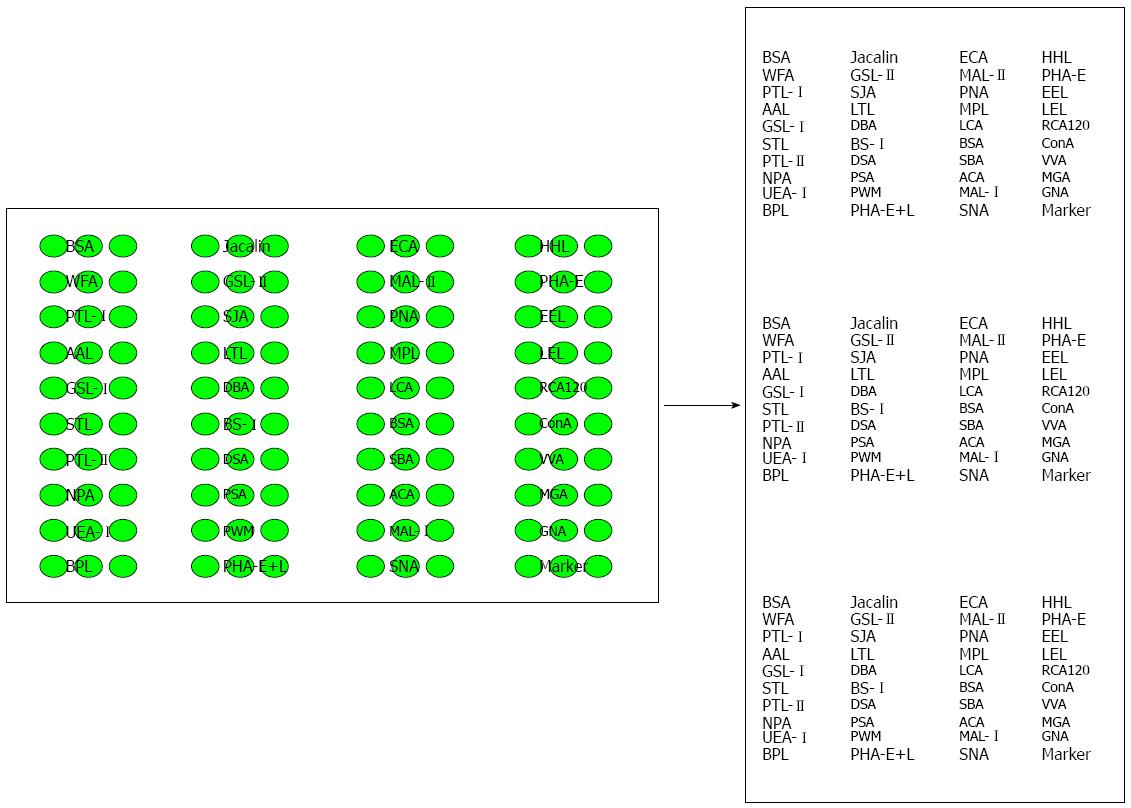
Figure 1 Sugar-binding specificities of the lectins and the layout of the lectin microarray.
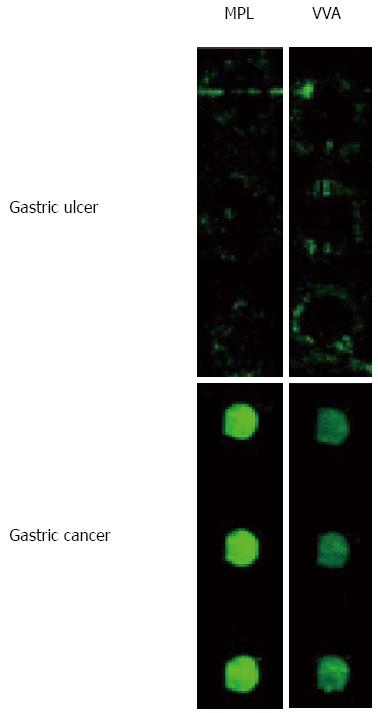
Figure 2 Glycopatterns of gastric cancer and ulcer according to lectin microarrays.
After scanning of MPL and VVA lectins, a diagram was shown.
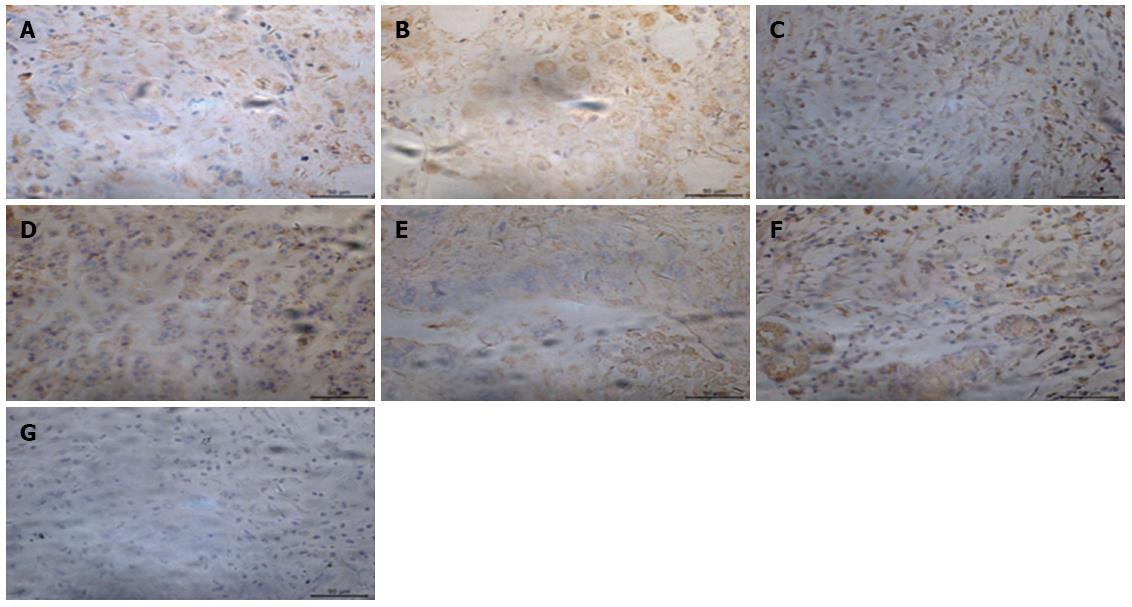
Figure 3 Level of GalNAc bound by MPL in various types of gastric cancer and gastric ulcer.
A: Staining of adenocarcinoma (× 400); B: Staining of signet ring cell carcinoma (× 400); C: Staining of undifferentiated carcinoma (× 400); D: Staining of carcinoid (× 400); E: Staining of lymphatic metastatic adenocarcinoma (× 400); F: Staining of intra-mucosal carcinoma (× 400); G: Staining of gastric ulcer (× 400).
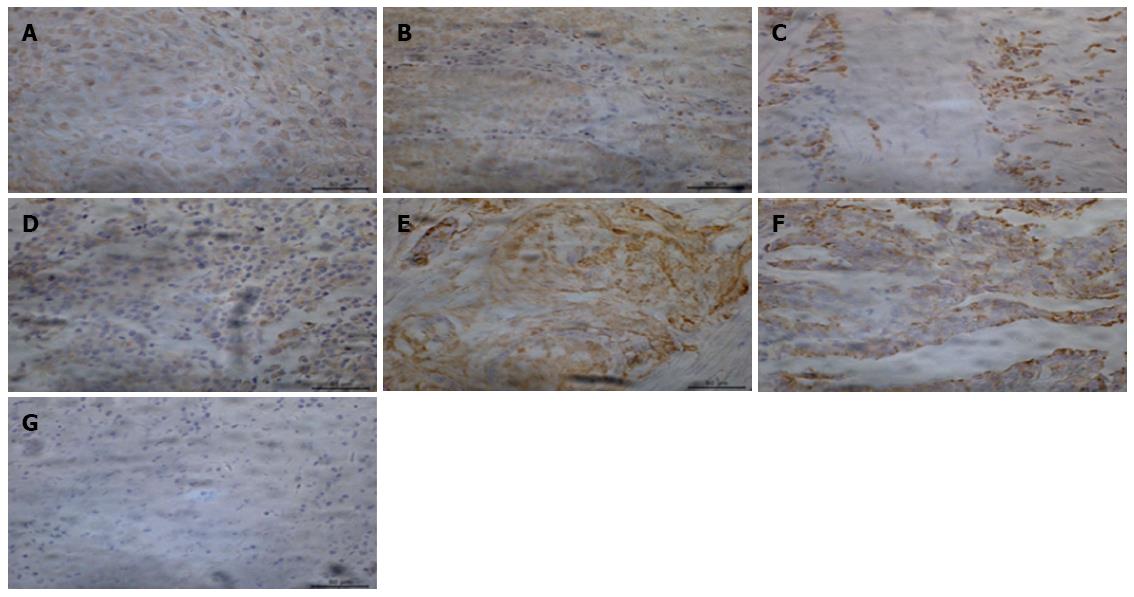
Figure 4 Level of GalNAc bound by VVA in various types of gastric cancer and gastric ulcer.
A: Staining of adenocarcinoma (× 400); B: Staining of signet ring cell carcinoma (× 400); C: Staining of undifferentiated carcinoma (× 400); D: Staining of carcinoid (× 400); E: Staining of lymphatic metastatic adenocarcinoma (× 400); F: Staining of intra-mucosal carcinoma (× 400); G: Staining of gastric ulcer (× 400).
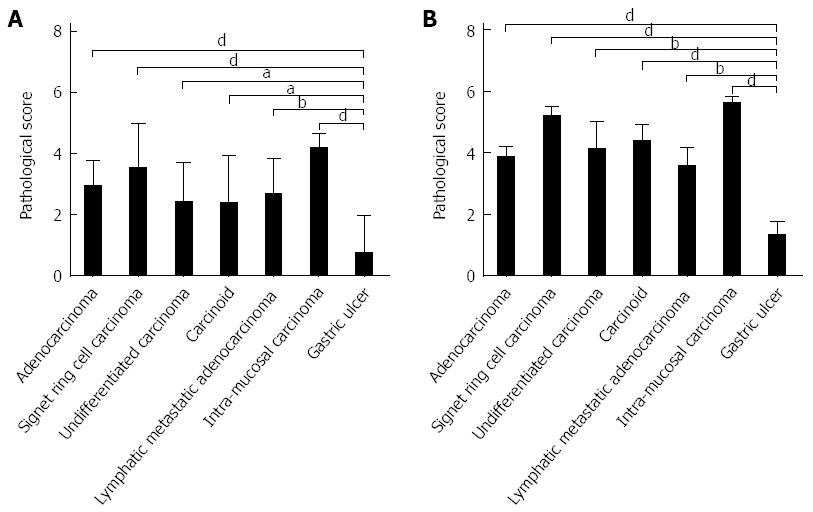
Figure 5 Pathological score of tissue staining.
The figure compares gastric ulcer and various types of gastric cancer. A indicates MPL, and B represents VVA. aP < 0.05, bP < 0.01, dP < 0.01.
- Citation: Huang WL, Li YG, Lv YC, Guan XH, Ji HF, Chi BR. Use of lectin microarray to differentiate gastric cancer from gastric ulcer. World J Gastroenterol 2014; 20(18): 5474-5482
- URL: https://www.wjgnet.com/1007-9327/full/v20/i18/5474.htm
- DOI: https://dx.doi.org/10.3748/wjg.v20.i18.5474


