©2014 Baishideng Publishing Group Co.
World J Gastroenterol. Mar 28, 2014; 20(12): 3100-3111
Published online Mar 28, 2014. doi: 10.3748/wjg.v20.i12.3100
Published online Mar 28, 2014. doi: 10.3748/wjg.v20.i12.3100
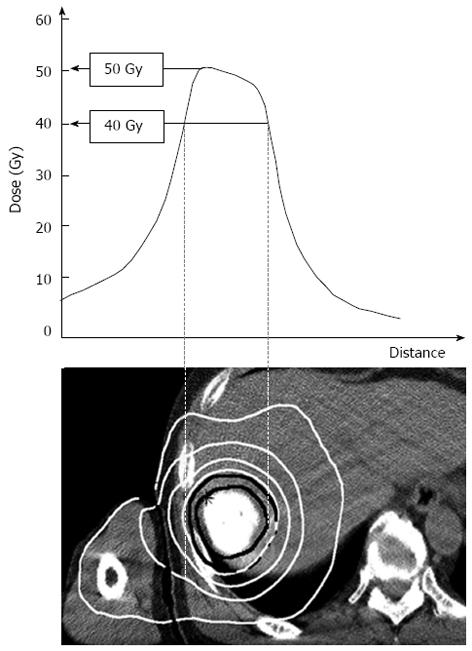
Figure 1 Dose distribution of stereotactic body radiation therapy for hepatocellular carcinoma at a dose of 40 Gy in 5 fractions, prescribed at the periphery of the target volume.
The isodose lines (white solid lines) from inner to outer represent 40, 30, 20 and 10 Gy, respectively. The center of the tumor receives as high as 125% of the prescribed dose.
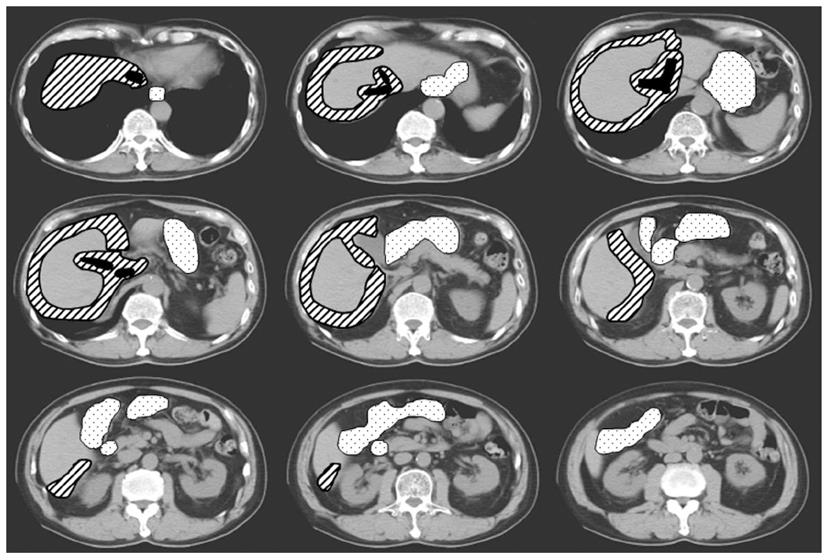
Figure 2 Computed tomography sections demonstrating typical locations treated with stereotactic body radiation therapy.
Areas indicated with hatched lines can be safely treated with stereotactic body radiation therapy (SBRT), although these areas are difficult to approach for percutaneous ablation. Liver tumors located adjacent to the stomach and bowels (dotted areas) are not suitable for SBRT. Other unmarked areas can be treated either with SBRT or percutaneous ablation.
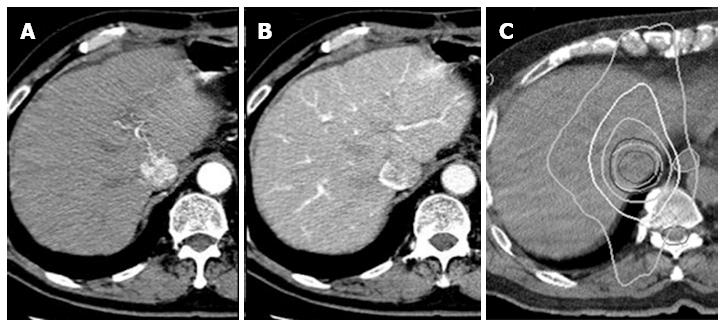
Figure 3 Hepatocellular carcinoma case that could not be effectively or safely treated with any treatment except for stereotactic body radiation therapy.
The tumor invading the vena cava is enhanced in arterial phase and shows a defect in portal phase on dynamic computed tomography (A and B). An axial view of radiation dose distribution. The isodose lines (white lines) from inner to outer represent 40, 30, 20, and 10 Gy, respectively (C).
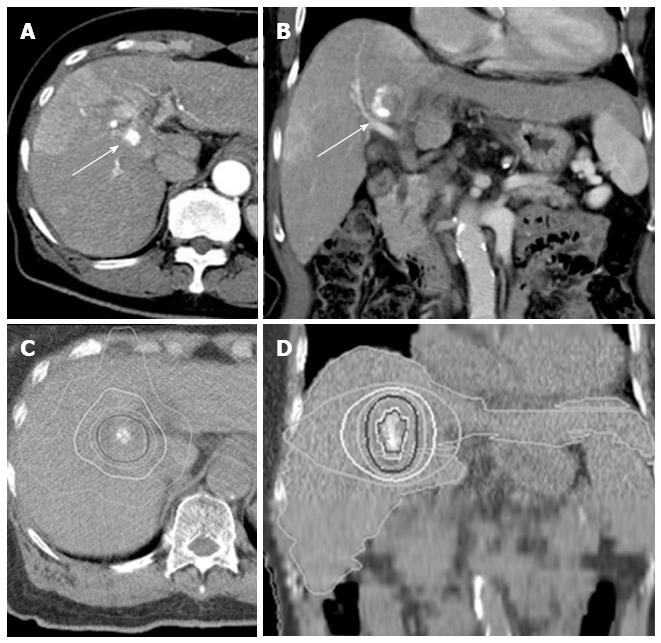
Figure 4 Case of hepatocellular carcinoma located in the hepatic hilum.
Surgical resection would have required a right lobectomy. Percutaneous ablative therapy was impossible due to involvement of the biliary system and large vessels near the tumor. Axial and coronal views of a tumor with partial lipiodol deposit (A and B, arrows). Axial and coronal views of radiation dose distribution (C and D). The isodose lines (white lines) from inner to outer represent 40, 30, 20, and 10 Gy, respectively.
Figure 5 Case of hepatocellular carcinoma.
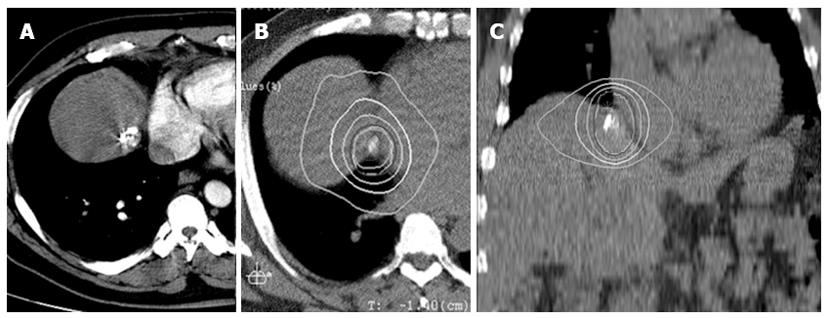
Located adjacent to the right atrium (A). Axial and coronal view of radiation dose distribution (B and C). The isodose lines (white lines) from inner to outer represent 40, 30, 20, and 10 Gy, respectively.
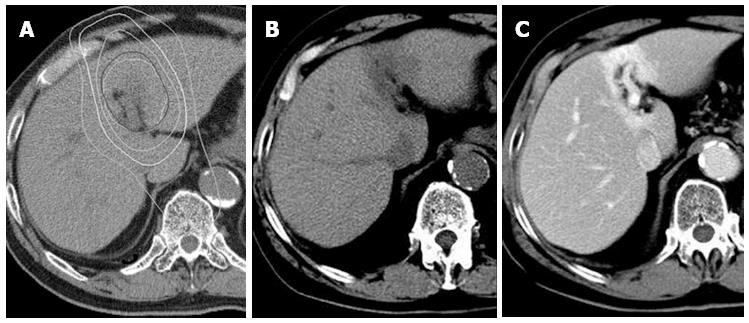
Figure 6 Typical focal liver reaction 3 mo after stereotactic body radiation therapy seen on computed tomography.
An axial view of radiation dose distribution (A). The isodose lines (white lines) from inner to outer represent 40, 30, 20, and 10 Gy, respectively. Pre-enhancement computed tomography shows a low-density lesion corresponding to a high-dose area (B). A well-demarcated enhancement due to contrast retention indicating congestion is seen in portal phase (C).
Figure 7 Typical focal liver reaction 4 mo after stereotactic body radiation therapy seen on gadoxetate acid-enhanced magnetic resonance imaging.
An axial view of radiation dose distribution (A). The isodose lines (white lines) from inner to outer represent 40, 30, 20, and 10 Gy, respectively. A T2-weighted image shows a high-intensity area corresponding to a high-dose area (B), which is seen as an enhanced area in early phase after injection of gadoxetate acid (C). The hepatobiliary phase shows a well-demarcated low-intensity area (D).
- Citation: Sanuki N, Takeda A, Kunieda E. Role of stereotactic body radiation therapy for hepatocellular carcinoma. World J Gastroenterol 2014; 20(12): 3100-3111
- URL: https://www.wjgnet.com/1007-9327/full/v20/i12/3100.htm
- DOI: https://dx.doi.org/10.3748/wjg.v20.i12.3100


