Copyright
©2013 Baishideng Publishing Group Co.
World J Gastroenterol. Mar 7, 2013; 19(9): 1472-1477
Published online Mar 7, 2013. doi: 10.3748/wjg.v19.i9.1472
Published online Mar 7, 2013. doi: 10.3748/wjg.v19.i9.1472
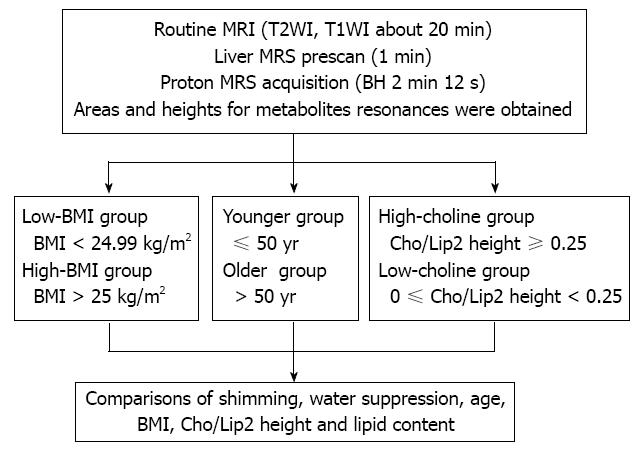
Figure 1 Detailed scanning protocols and statistical analysis.
BMI: Body mass index; MRS: Magnetic resonance spectroscopy; Cho/Lip2: Choline/lipid2; MRI: Magnetic resonance imaging.
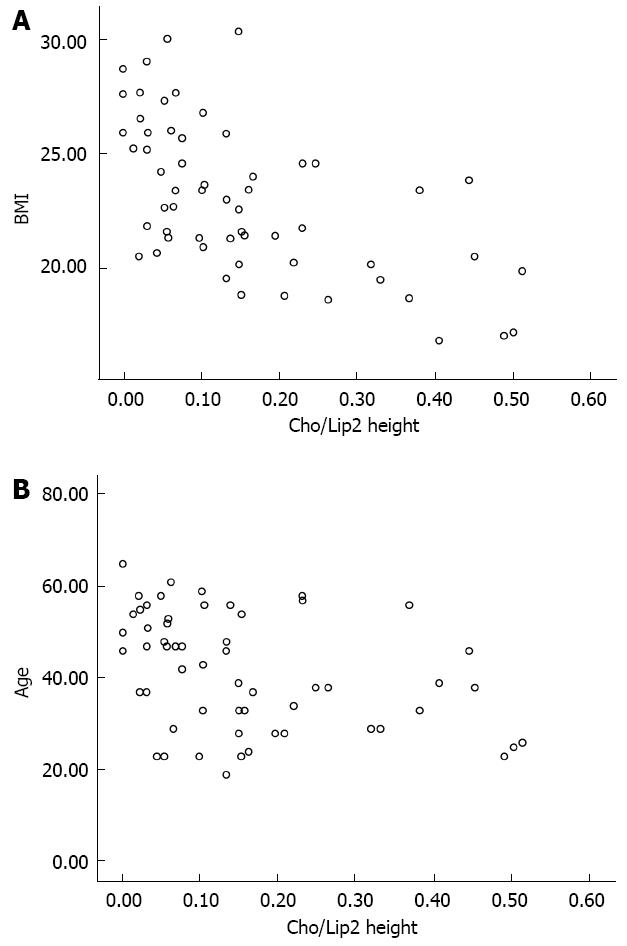
Figure 2 Scatter plots of relationships.
A: Between choline/lipid2 (Cho/Lip2) and body mass index (BMI), a good inverse correlation was observed; B: Between Cho/Lip2 and age, a moderate inverse correlation was observed.
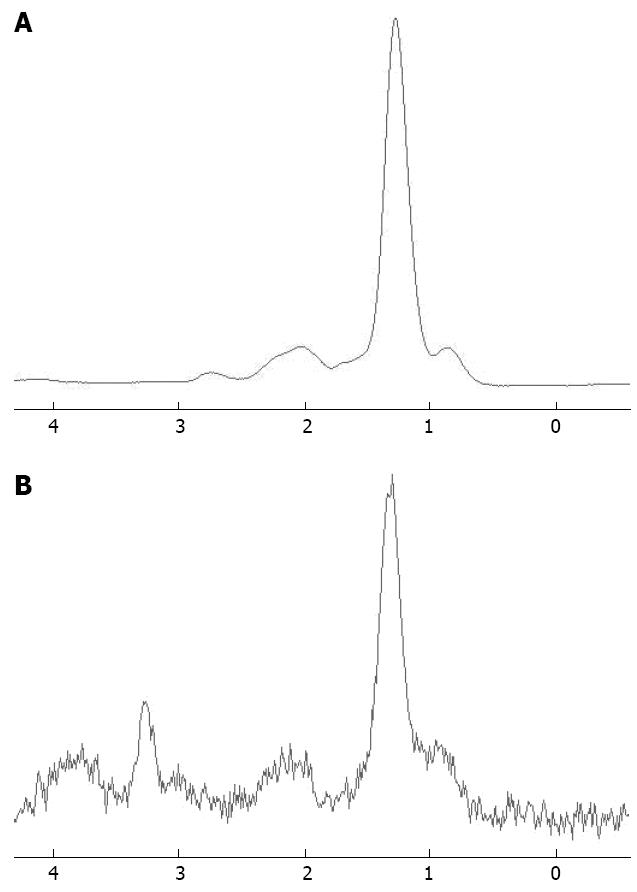
Figure 3 Point resolved spectroscopy-localized single voxel 1H magnetic resonance spectrum.
A: Originating from liver parenchyma of an obese and elderly (body mass index = 30.04, 52 years) volunteer. No observable choline peak was detected at 3.2 ppm; B: Originating from liver parenchyma of a lean and young volunteer (body mass index = 18.87, 23 years). High-choline peak was detected at 3.2 ppm.
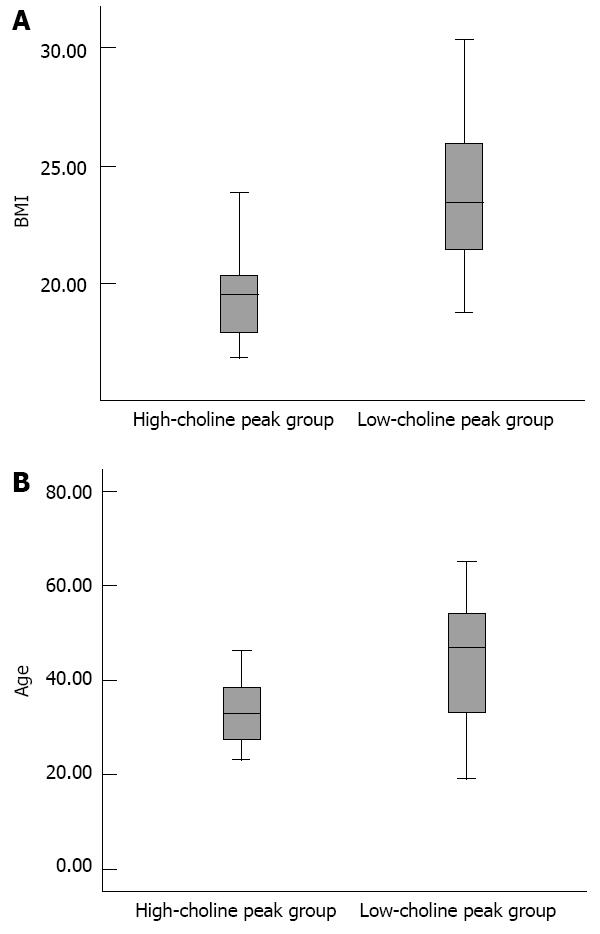
Figure 4 High-choline peak group.
A: Had lower body mass index than the low-choline group; B: Was younger than the low-choline group. BMI: Body mass index.
- Citation: Xu L, Liu B, Huang Y, Liu X, Zhang SW, Xin XG, Zheng JZ. 3.0 T proton magnetic resonance spectroscopy of the liver: Quantification of choline. World J Gastroenterol 2013; 19(9): 1472-1477
- URL: https://www.wjgnet.com/1007-9327/full/v19/i9/1472.htm
- DOI: https://dx.doi.org/10.3748/wjg.v19.i9.1472


