Copyright
©2013 Baishideng Publishing Group Co.
World J Gastroenterol. Mar 7, 2013; 19(9): 1405-1415
Published online Mar 7, 2013. doi: 10.3748/wjg.v19.i9.1405
Published online Mar 7, 2013. doi: 10.3748/wjg.v19.i9.1405
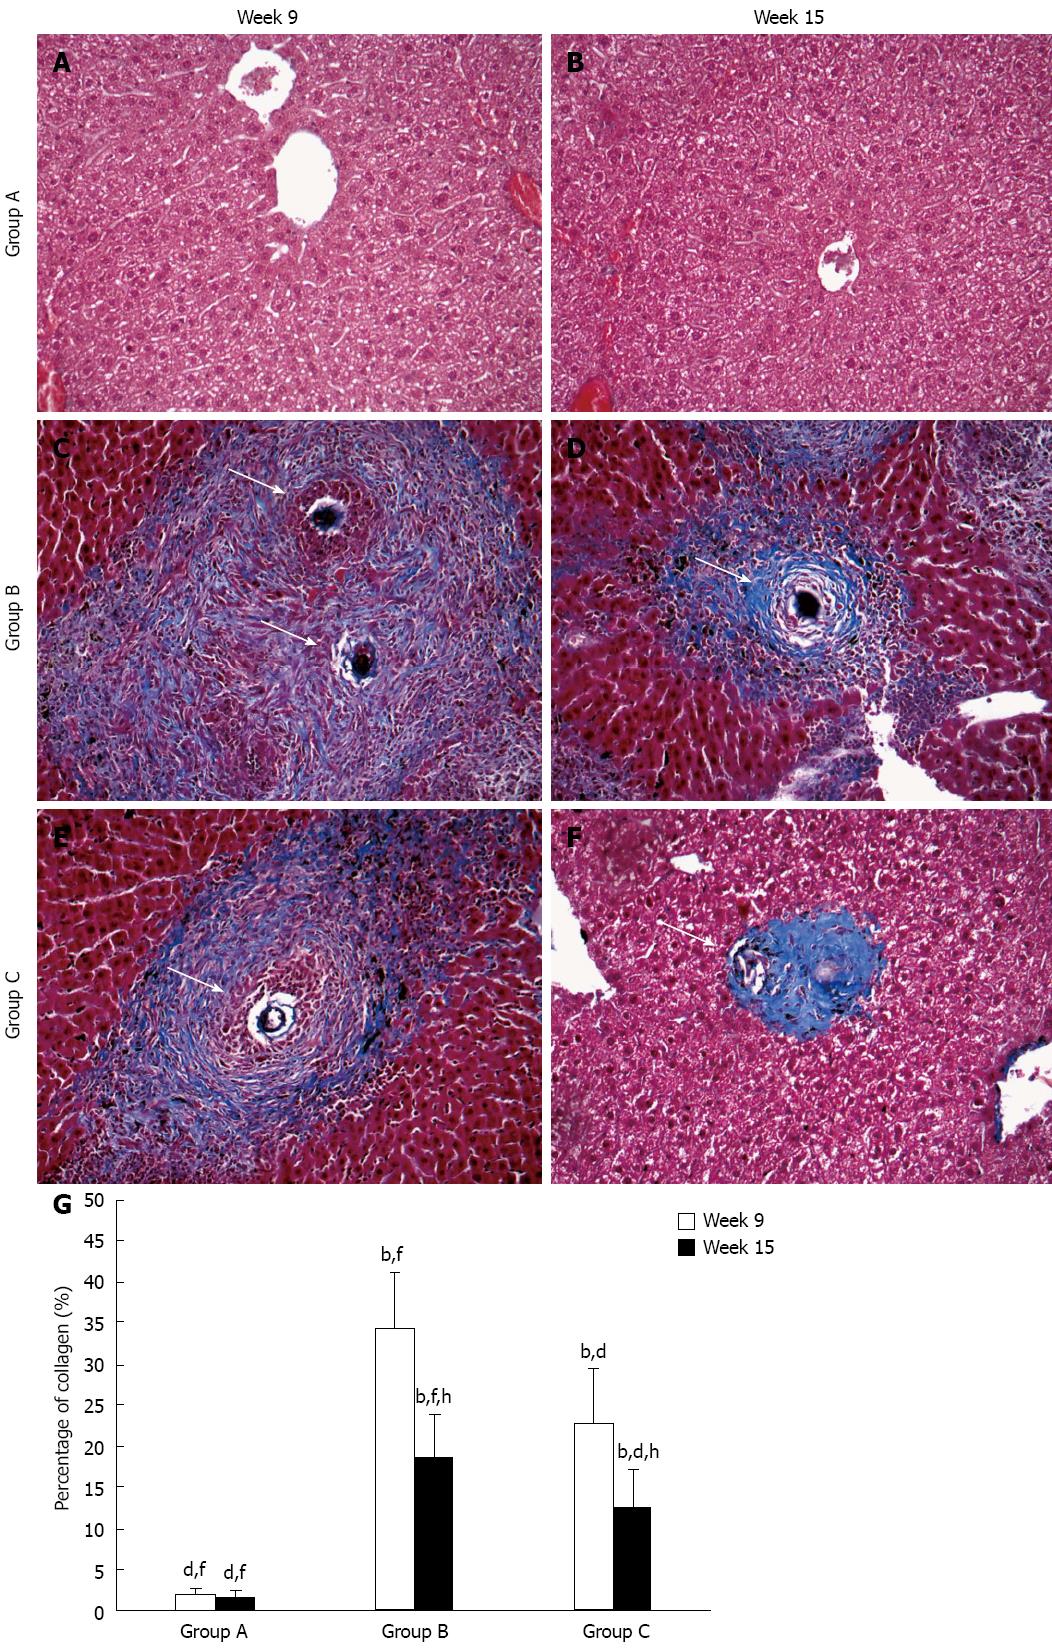
Figure 1 Representative images of schistosomal hepatic fibrosis in the groups over time.
Collagen fibers are stained blue and arrows show egg granulomas. Original magnification 100×. Histogram shows the percentage of collagen which represented the degree of hepatic fibrosis. bP < 0.01 vs group A; dP < 0.01 vs group B; fP < 0.01 vs group C; hP < 0.01 vs week 9.
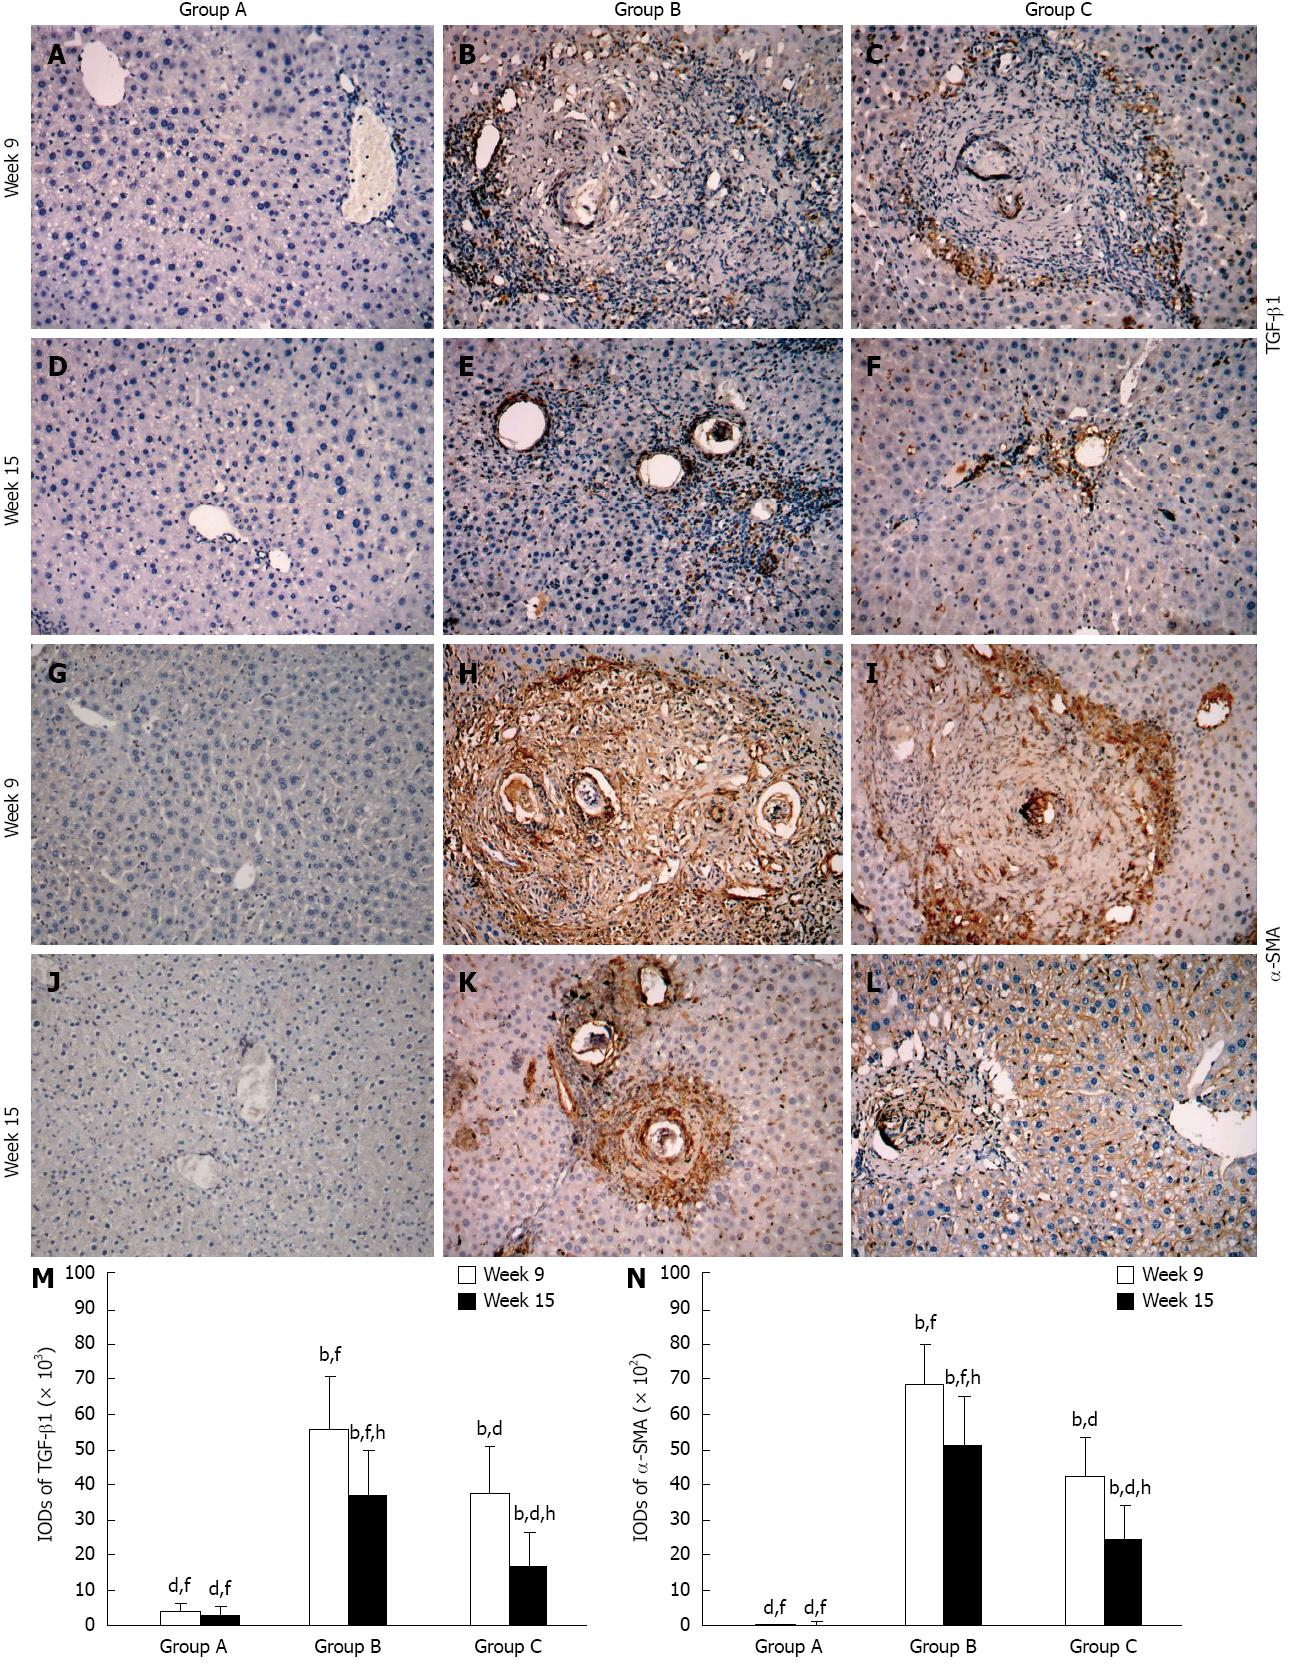
Figure 2 Representative images of immunostaining for transforming growth factor-beta 1 and alpha-smooth muscle actin in the groups over time.
Target protein positive staining is yellow, brownish-yellow or snuff. Original magnification 100×. Histogram shows integral optical densities of target proteins. TGF-β1: Transforming growth factor-beta 1; α-SMA: Alpha-smooth muscle actin; IOD: Integral optical density. bP < 0.01 vs group A; dP < 0.01 vs group B; fP < 0.01 vs group C; hP < 0.01 vs week 9.
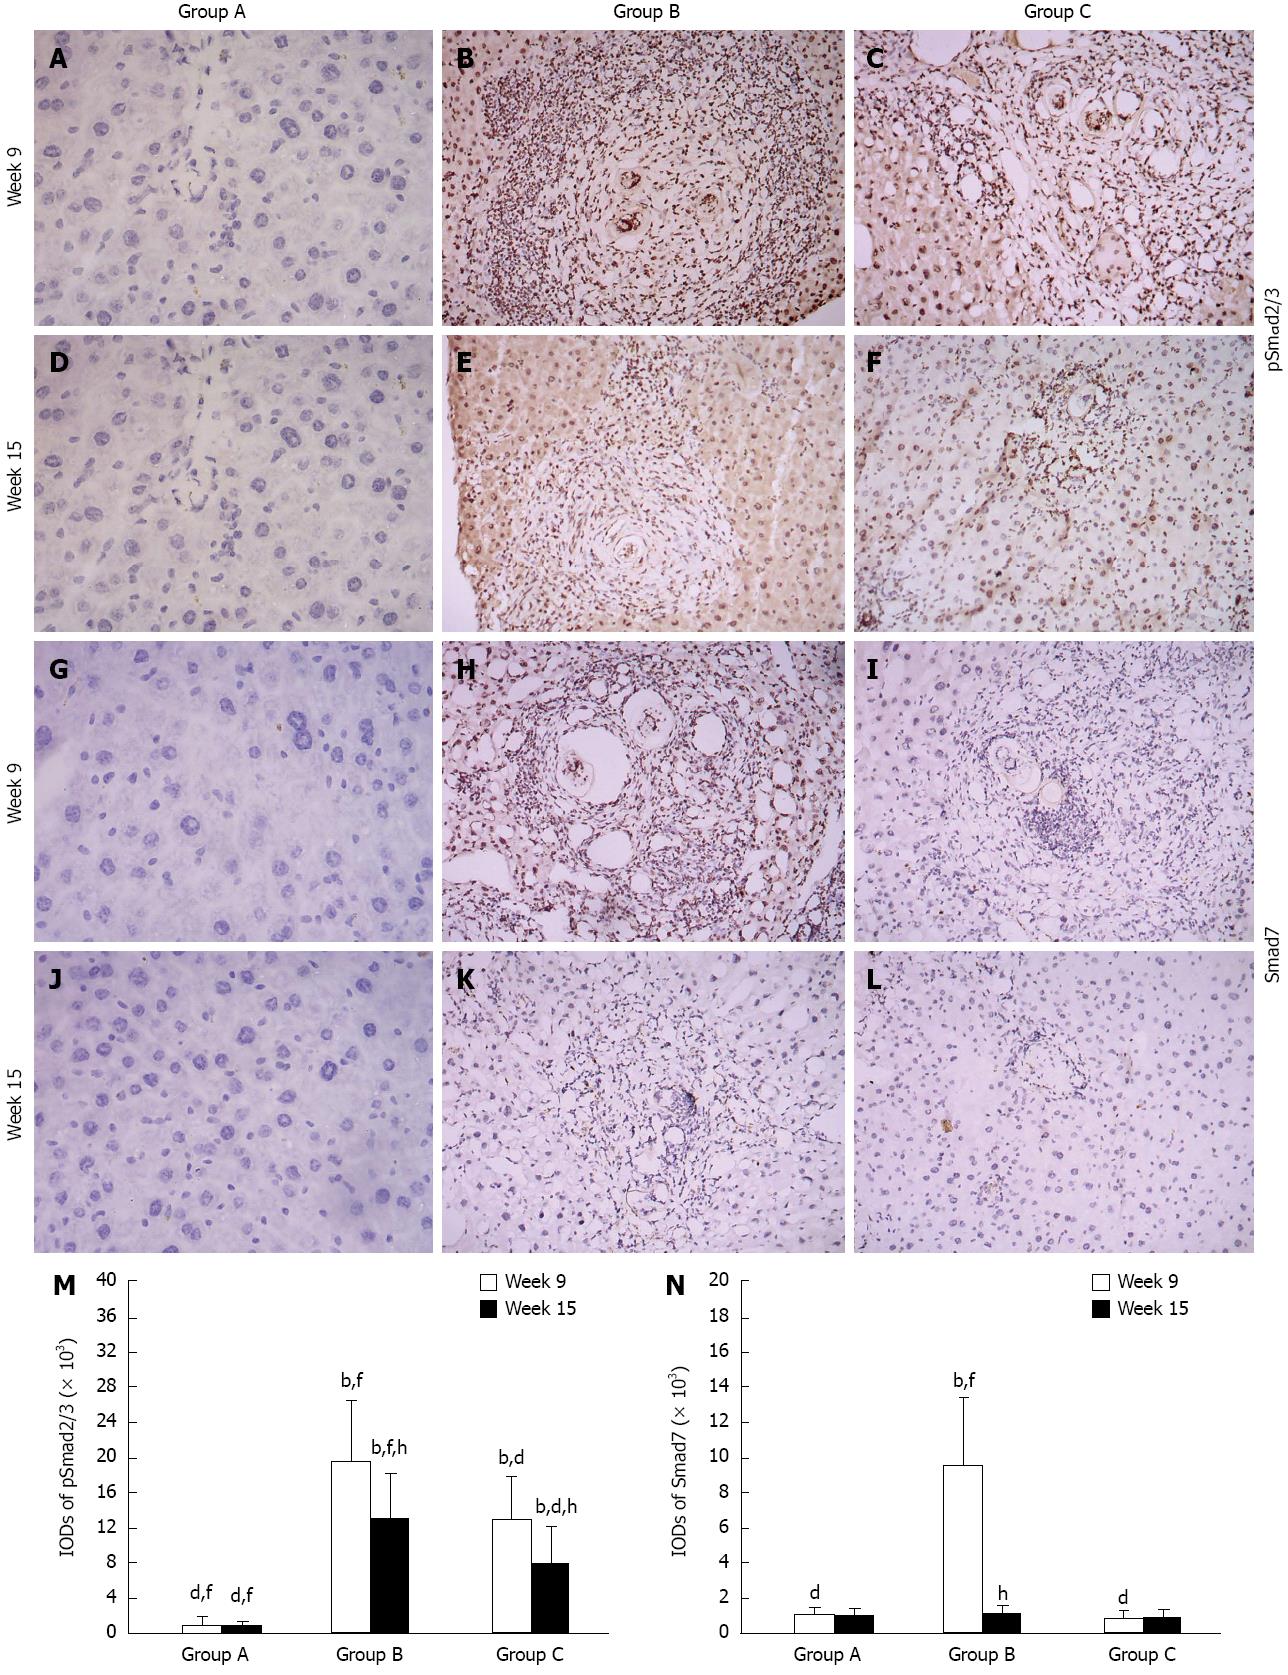
Figure 3 Representative images of immunostaining for pSmad2/3 and Smad7 in the groups over time.
Target protein positive staining is yellow or brownish-yellow. Original magnification 100×. Histogram shows integral optical densities of target proteins. bP < 0.01 vs group A; dP < 0.01 vs group B; fP < 0.01 vs group C; hP < 0.01 vs week 9. IOD: Integral optical density.
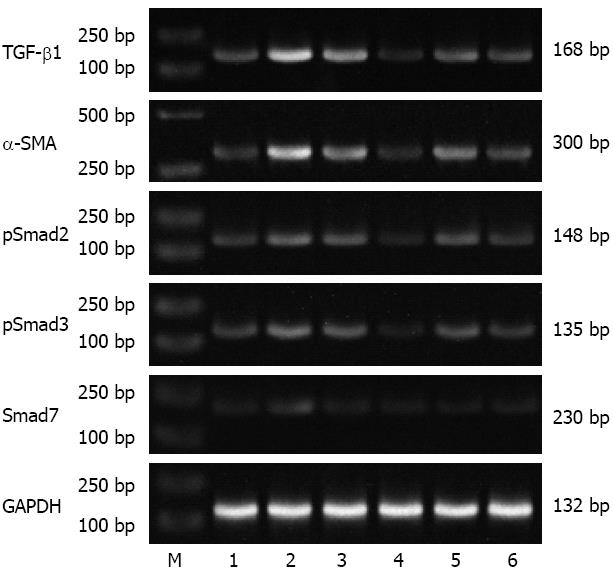
Figure 4 Representative electrophoretic bands of transforming growth factor-beta 1, alpha-smooth muscle actin, pSmad2, pSmad3 and Smad7 mRNA (reverse transcription-polymerase chain reaction).
Numbers 1-3 represent group A, B and C, respectively, at 9 wk; Numbers 4-6 represent group A, B and C, respectively, at 15 wk. The 132 bp glyceraldehyde-3-phosphate dehydrogenase (GAPDH) mRNA fragment was used as an internal control. M: Marker; TGF-β1: Transforming growth factor-beta 1; α-SMA: Alpha-smooth muscle actin.
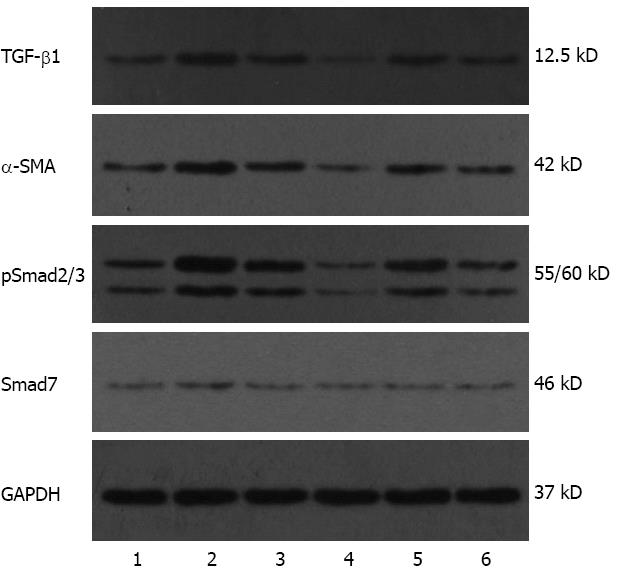
Figure 5 Representative electrophoretic bands of transforming growth factor-beta 1, alpha-smooth muscle actin, pSmad2/3 and Smad7 protein (Western blotting).
Numbers 1-3 represent group A, B and C, respectively, at 9 wk. Numbers 4-6 represent group A, B and C, respectively, at 15 wk. The 37 kD glyceraldehyde-3-phosphate dehydrogenase (GAPDH) was used as an internal control. TGF-β1: Transforming growth factor-beta 1; α-SMA: Alpha-smooth muscle actin.
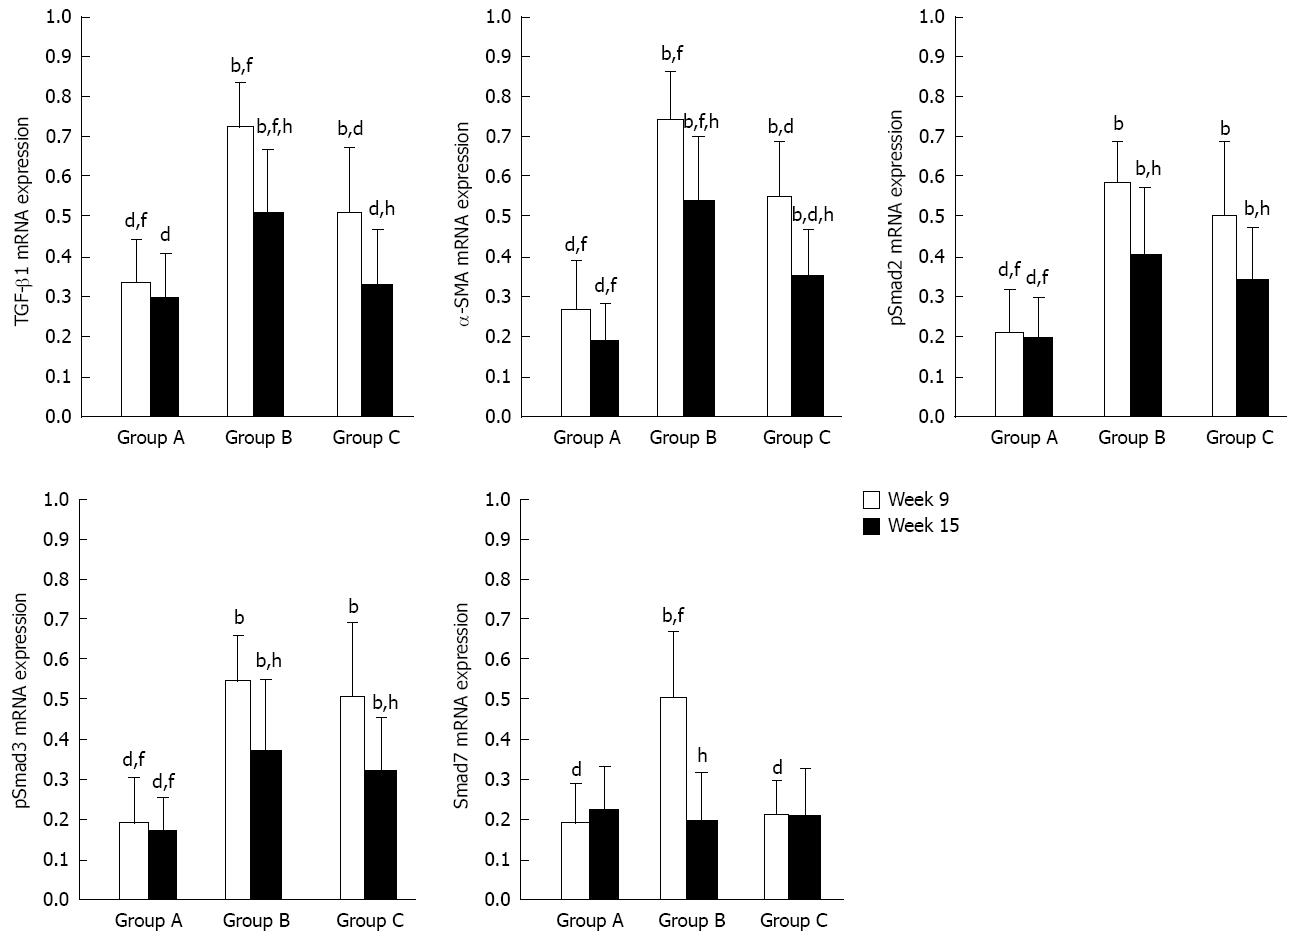
Figure 6 Relative mRNA expressions (target gene integral optical density/glyceraldehyde-3-phosphate dehydrogenase integral optical density, reverse transcription-polymerase chain reaction) of transforming growth factor-beta 1, alpha-smooth muscle actin, pSmad2, pSmad3 and Smad7.
TGF-β1: Transforming growth factor-beta 1; α-SMA: Alpha-smooth muscle actin. bP < 0.01 vs group A; dP < 0.01 vs group B; fP < 0.01 vs group C; hP < 0.01 vs week 9.
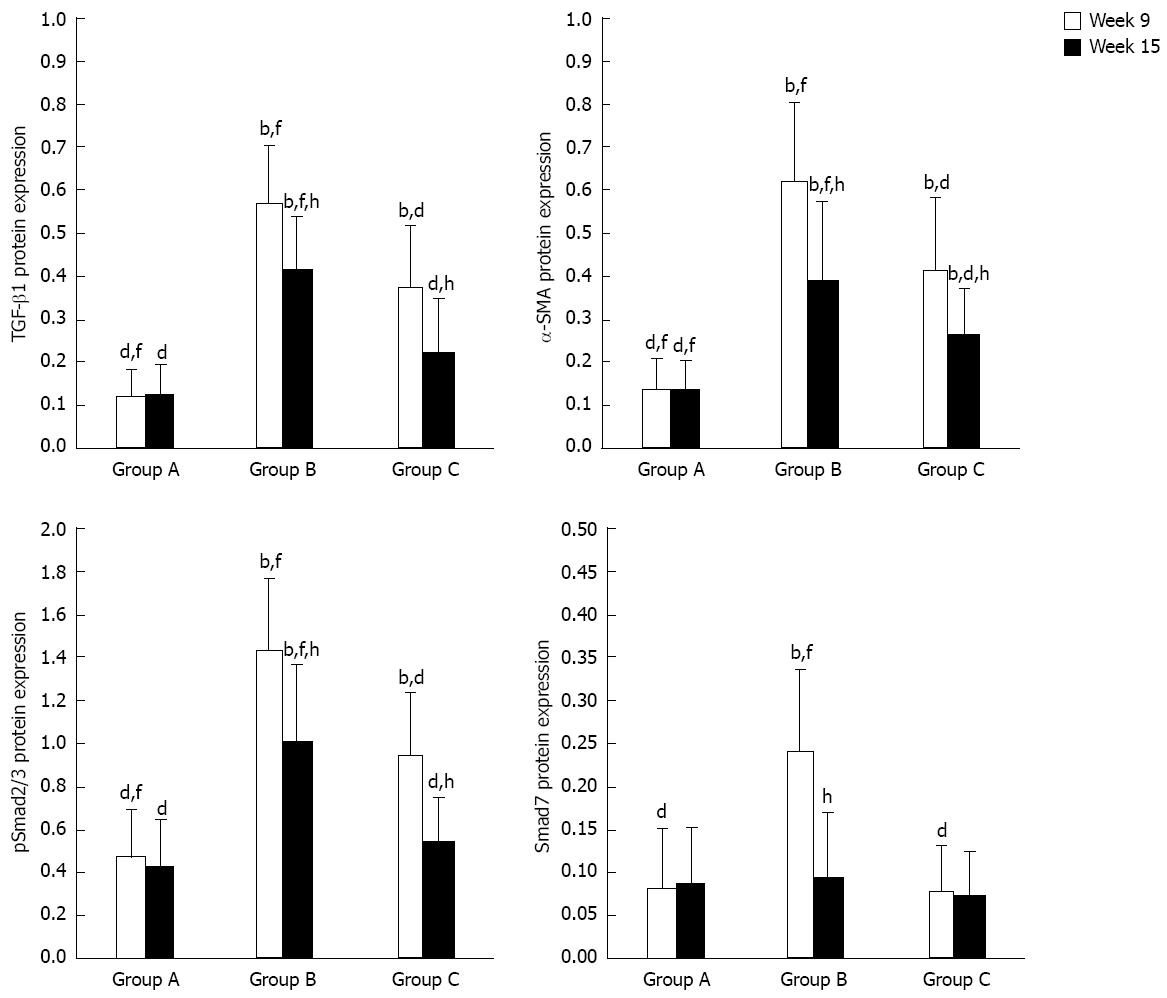
Figure 7 Relative protein expressions (target protein integral optical density/glyceraldehyde-3-phosphate dehydrogenase integral optical density, Western blotting) of transforming growth factor-beta 1, alpha-smooth muscle actin, pSmad2/3 and Smad7.
TGF-β1: Transforming growth factor-beta 1; α-SMA: Alpha-smooth muscle actin. bP < 0.01 vs group A; dP < 0.01 vs group B; fP < 0.01 vs group C; hP < 0.01 vs week 9.
-
Citation: Chen BL, Peng J, Li QF, Yang M, Wang Y, Chen W. Exogenous bone morphogenetic protein-7 reduces hepatic fibrosis in
Schistosoma japonicum -infected micevia transforming growth factor-β/Smad signaling. World J Gastroenterol 2013; 19(9): 1405-1415 - URL: https://www.wjgnet.com/1007-9327/full/v19/i9/1405.htm
- DOI: https://dx.doi.org/10.3748/wjg.v19.i9.1405


